
Key Takeaways
You can't monitor agents like traditional software. Inputs are infinite, behavior is non-deterministic, and quality lives in the conversations themselves. This article explains what to monitor, how to scale evaluation, and how production traces become the foundation for continuous improvement.
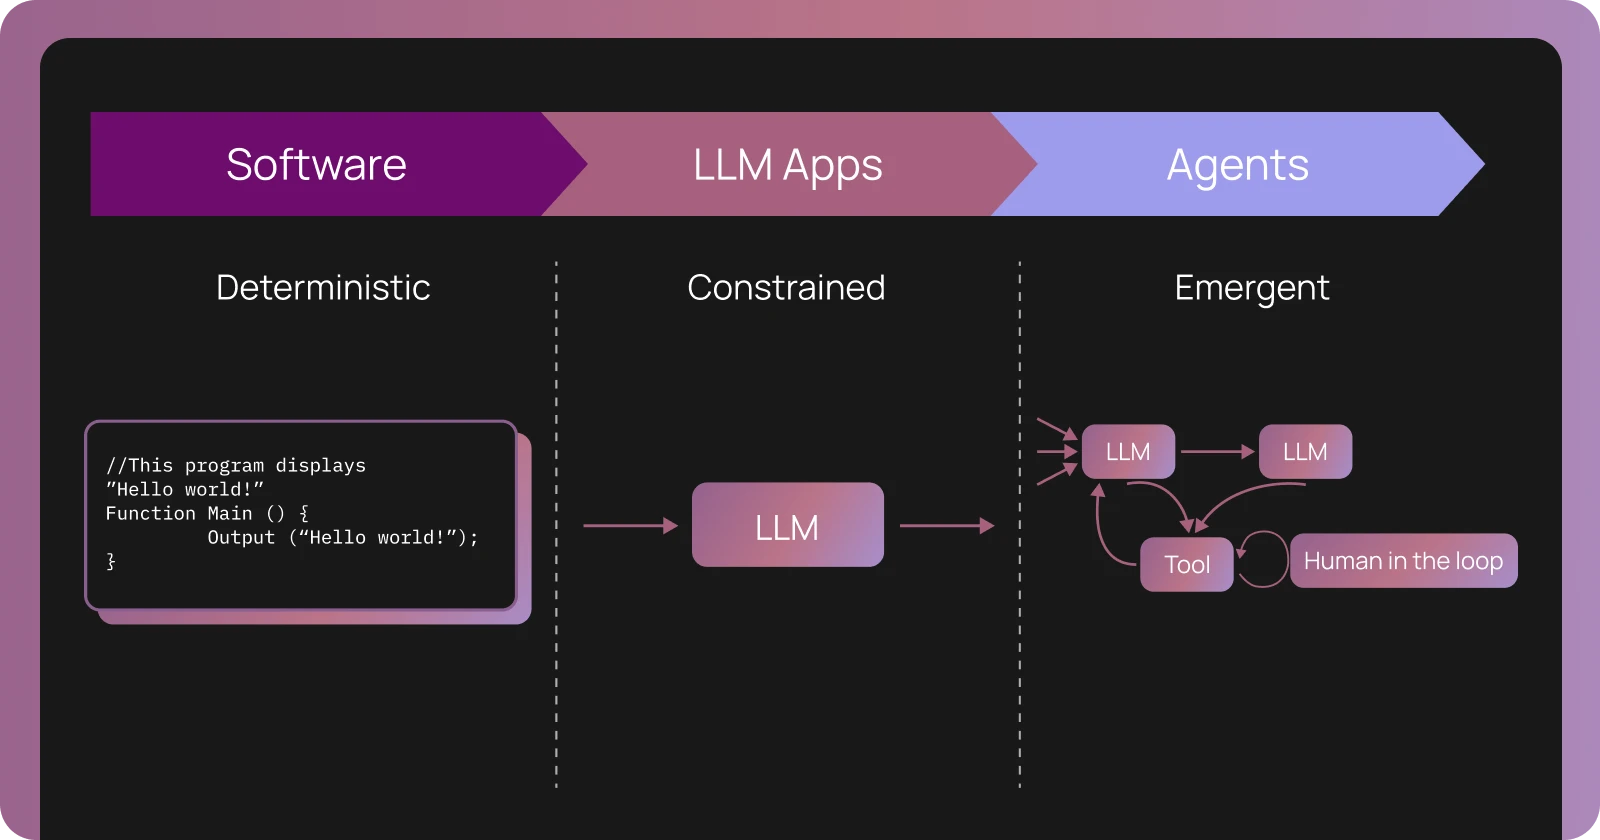
When you ship traditional software to production, you have a good sense of what to expect. Users click buttons, fill out forms, navigate through predetermined paths. Your test suite might cover 80-90% of code paths, and monitoring tools track the usual suspects: error rates, response times, database queries. When something breaks, you look at stack traces and logs.
Agents operate differently. They accept natural language input, where the space of possible queries is unbounded. They're powered by large language models that are sensitive to subtle variations in prompts and can produce different outputs for the same input. And they make decisions through multi-step reasoning chains, tool calls, and retrieval operations that are difficult to fully anticipate during development.
This means that production monitoring for agents requires different capabilities than traditional observability. In this post, we'll explore why agent observability has distinct challenges, what you need to monitor, and what we've learned from teams deploying agents at scale.
Why agents are different from traditional software
Working with teams deploying agents to production, we've observed two key distinctions that affect monitoring approaches.
Agent have an infinite input space
Traditional software has a finite, constrained input space. Users interact through buttons, dropdowns, forms, and API calls with specific formats. When you design a checkout flow, you know the exact sequence of screens and possible user actions. Your error handling can be comprehensive because you can enumerate the failure modes.
Agents, by contrast, accept natural language as their primary input. Natural language has no fixed set of valid inputs. Users can phrase the same request in countless ways — vague or specific, formal or casual, combining multiple intents in a single message or spreading a single request across multiple turns.
Consider a customer support agent. In traditional software, users would navigate to "Order History," click on an order, click "Request Refund," and finally fill out a form with predefined options. The path is fixed and testable.
With an agent, users might say:
- "I want to return my order"
- "Can you help me get my money back for the shoes I bought last week?"
- "The item I received is damaged, what are my options?"
- "order #12345 refund please"
.png)
Each represents the same underlying intent, but the agent needs to understand the variation, extract the relevant information, and determine the appropriate actions.
This infinite input space means you cannot fully predict how your agent will be used until real users start interacting with it.
LLMs are not robust to small changes
The second key difference is that LLMs exhibit prompt sensitivity and non-deterministic behavior. Even small variations in input can lead to different outputs, and the same input can sometimes produce different results.
This happens for several reasons. LLMs use probabilistic sampling during generation, which introduces variance. Most importantly, LLMs respond differently to subtle changes in phrasing, context, or instruction ordering.
This non-determinism means that the behavior you observe in development may not match what happens in production. A prompt that works reliably in testing might fail on edge cases you didn't encounter. An agent that correctly uses tools during evaluation might occasionally select the wrong tool for user queries with slightly different phrasing.
Production monitoring for agents is different
Traditional Application Performance Monitoring (APM) tools focus on metrics like latency, traffic, errors, and saturation. They track HTTP requests, database queries, and system resources. They're designed for structured, deterministic systems where you know the possible code paths.
Agent observability requires monitoring the inputs and outputs themselves, not just the system metrics around them.
Monitoring natural language interactions
When your agent is having conversations with users, the primary signal lives in the conversations themselves. You need to capture:
- Complete prompt-response pairs: Not just that a request happened, but what the user asked and what the agent responded
- Multi-turn context: Agents often operate across multiple exchanges as part of one conversation, so you need to group related interactions together
- Agent trajectory and intermediate steps: Agents can take multi-step paths to reach a final output, calling tools and reasoning through options. You need visibility into each step of the trajectory, not just the final response
This is qualitatively different from traditional logging. A traditional web request might be summarized as "POST /api/checkout 200 OK 342ms." An agent interaction is a natural language conversation with potentially dozens of steps — and the question of whether it went well isn't answerable from the status code.
The challenge of human judgment at scale
Natural language interactions often require human judgment to evaluate properly. Is this response helpful? Did the agent understand the user's intent? Was the tone appropriate? Did it retrieve relevant information?
During development, this is manageable — you review traces manually, tweak prompts, and iterate. But in production, you might be handling thousands or millions of interactions. Human reviewers can meaningfully assess 50-100 traces per hour, but at 1,000 requests per day, full manual review would require 10-20 hours of dedicated human time, daily. This raises an important question: how do you bring human intelligence to production data when manual review doesn't scale?
We've found two complementary approaches effective.
Annotation queues for structured human review
Annotation queues help make human review as efficient as possible. Rather than asking reviewers to hunt through production logs, an annotation queue presents specific runs in a structured format with a predefined rubric.
An effective annotation queue system lets you:
- Route specific traces for review: Instead of reviewing everything, send particular subsets to the queue (runs with negative feedback, high-cost interactions, or queries from a specific time window)
- Define review criteria: Set up rubrics so reviewers know exactly what to evaluate (relevance, correctness, tone, safety)
- Enable team collaboration: Multiple reviewers can work through queues with progress tracking and role assignments
- Create feedback loops: Reviewed data can be annotated with corrections and added to evaluation datasets

Annotation queues are especially valuable when you're trying to understand a new failure mode, build up training data for evaluators, or get expert domain feedback on specialized queries.
Trade-offs to consider: Annotation queues require dedicated reviewer time and can introduce latency into the improvement cycle. We've found they work best when focused on specific high-value traces rather than attempting comprehensive coverage.
LLM as a proxy for human judgment
The second approach is to use LLMs themselves to scale human judgment. While LLMs aren't perfect evaluators, they can assess many quality dimensions at a scale that humans cannot.
In particular, you can configure online evaluators to run automatically on production traffic, either on all runs or on a sampled subset. These evaluators can check:
- Reference-free quality metrics: Attributes like coherence and tone that don't require a ground truth answer
- Safety and compliance: Whether responses contain sensitive information, violate policies, or exhibit harmful behavior
- Format validation: Whether outputs follow expected structures or contain required elements
- Topic classification: What categories of requests users are making
LLMs can assess natural language at a scale beyond human review. While humans might review dozens of traces, an LLM evaluator can assess thousands, flagging potential issues and providing aggregate metrics.
However, LLM-based evaluations also introduce their own costs and constraints:
- Latency: Evaluators can add a few seconds of latency per trace, which may be acceptable for async batch evaluation but not for synchronous user feedback
- Cost: Evaluating all traces can add to your inference costs, which is why we typically recommend sampling 10-20% of traffic
- Accuracy: Off-the-shelf evaluators may not reflect what "good" means for your specific app. Custom LLM-as-a-judge evaluators aligned to your use case are often necessary, but ensuring they agree with human judgment can also be difficult. We built Align Evals to help teams validate their custom evaluators are calibrated against human labels before you trust them at scale.
- Evaluation drift: As production traffic shifts, evaluators may need retuning or replacement
For these reasons, we recommend combining automated evaluation with periodic human review rather than relying solely on LLM evaluators.
Tools for production agent observability
Building effective production observability for agents requires a specific set of capabilities, most of which general-purpose monitoring tools weren't designed to provide. Based on patterns we observed across dozens of production deployments, we built the following into LangSmith.
Insights Agent: Discovering usage and error patterns
One of the more challenging aspects in production is simply understanding what users are doing with your agent.
When we analyzed how teams were using production traces, we found they needed a way to automatically discover patterns without specifying what to look for upfront. This motivated us to build Insights Agent, which uses an automated clustering system that groups similar traces to identify:
- Usage patterns: What are the most common types of requests users make? Which features or capabilities are they trying to use?
- Error modes: Where is the agent making mistakes? Are there common failure patterns like incorrect tool selection, retrieval failures, or misunderstanding user intent?
- Edge cases: What unexpected queries are users sending that you didn't account for?

Insights Agent can be configured to group traces by usage patterns, failure modes, or custom attributes specific to your domain. You can also filter the analysis to specific subsets (time windows, user cohorts, feature areas) and save configurations for repeated analysis.
For example, a product manager at a company with an embedded copilot might ask: "What parts of our product are users trying to use the copilot for most often?" Insights Agent can analyze thousands of traces, group them by intent, and surface the top usage categories.
An engineer debugging quality issues might ask: "Where is my agent selecting the wrong tools?" Insights Agent can identify common patterns in tool selection failures and provide representative examples.
This automated pattern discovery helps make the volume of production traces more manageable and actionable.
Online Evaluations: Continuous quality monitoring
We mentioned online evaluations earlier as a way to scale human judgment. Let's look at how they work in practice.
With online evaluations, you set up evaluators that run automatically on production traces. You can configure:
- Which traces to evaluate: All traces, sampled percentages (typically 10-20%), or specific filtered subsets
- What to evaluate: Quality metrics, safety checks, format validation, or custom criteria
- When to alert: Thresholds that trigger notifications when metrics degrade
Online evaluations serve several purposes beyond traditional "testing":
- Quality monitoring: You can track how often the agent produces helpful, relevant, correct responses over time. This allows you to detect when quality degrades due to model updates, data drift, or new user patterns.
- Topic tagging: You can automatically classify production queries into categories for product analytics. This gives you visibility into what users are actually trying to accomplish.
- Trajectory evaluation: For agents that use multiple tools or reasoning steps, you can evaluate whether the agent took an appropriate path to the answer. Did it call the right tools in a sensible order? Did it retrieve relevant information?
- Security and safety: You can check for sensitive information in outputs, policy violations, or other safety concerns in real time.

The ability to run evaluations continuously on production traffic enables a development workflow where you can drill into specific failing traces, add them to annotation queues for human review, incorporate them into evaluation datasets, and test fixes before redeploying.
Dashboards and alerts: Monitoring what matters
Finally, production observability requires dashboards and alerting on metrics that matter to your specific use case. Effective observability platforms provide:
- Custom dashboards for domain-specific insights, allowing you to track success metrics (such as task completion rates or user satisfaction scores) for different workflows. You can also compare performance across model versions and monitor cost and latency by feature area
- Flexible alerting via webhooks or PagerDuty when metrics cross thresholds
- Drill-down capabilities from aggregate metrics into specific traces

Production observability requires tracking metrics specific to how agents actually behave. Beyond standard latency and error rates, this means monitoring metrics like tool call failure rates and run count by tool. These signals tell you whether the agent is actually working as intended, not just whether the system is running.
The key is monitoring business-critical metrics, not just technical ones. Yes, you care about latency and error rates. But you also care about metrics like user satisfaction, and whether the agent is being used for the intended purposes.
Why general-purpose tools fall short
At this point, you might wonder: couldn't I build this with traditional observability tools like Datadog or New Relic? Why do I need a specialized platform?
Many teams initially attempt to monitor agents using traditional APM tools. We've found this works for basic metrics (latency, error rates) but encounters limitations with agent-specific requirements. The gaps emerge in three areas: payloads, connectivity, and users.
Payloads: Natural language data
Traditional APM tools are optimized for structured logs and numeric metrics. When you need to store, search, and analyze full conversation threads with multi-turn context, you encounter different requirements:
- Storage scale: Full prompt-response pairs at production scale require significant storage. You need semantic search capabilities over prompts, not just keyword matching. And you need to preserve full context including system messages and few-shot examples.
- Data models: Maintaining conversation threads and state require different data structures than traditional traces.
We've seen teams build this on top of APM tools, but it requires significant custom development.
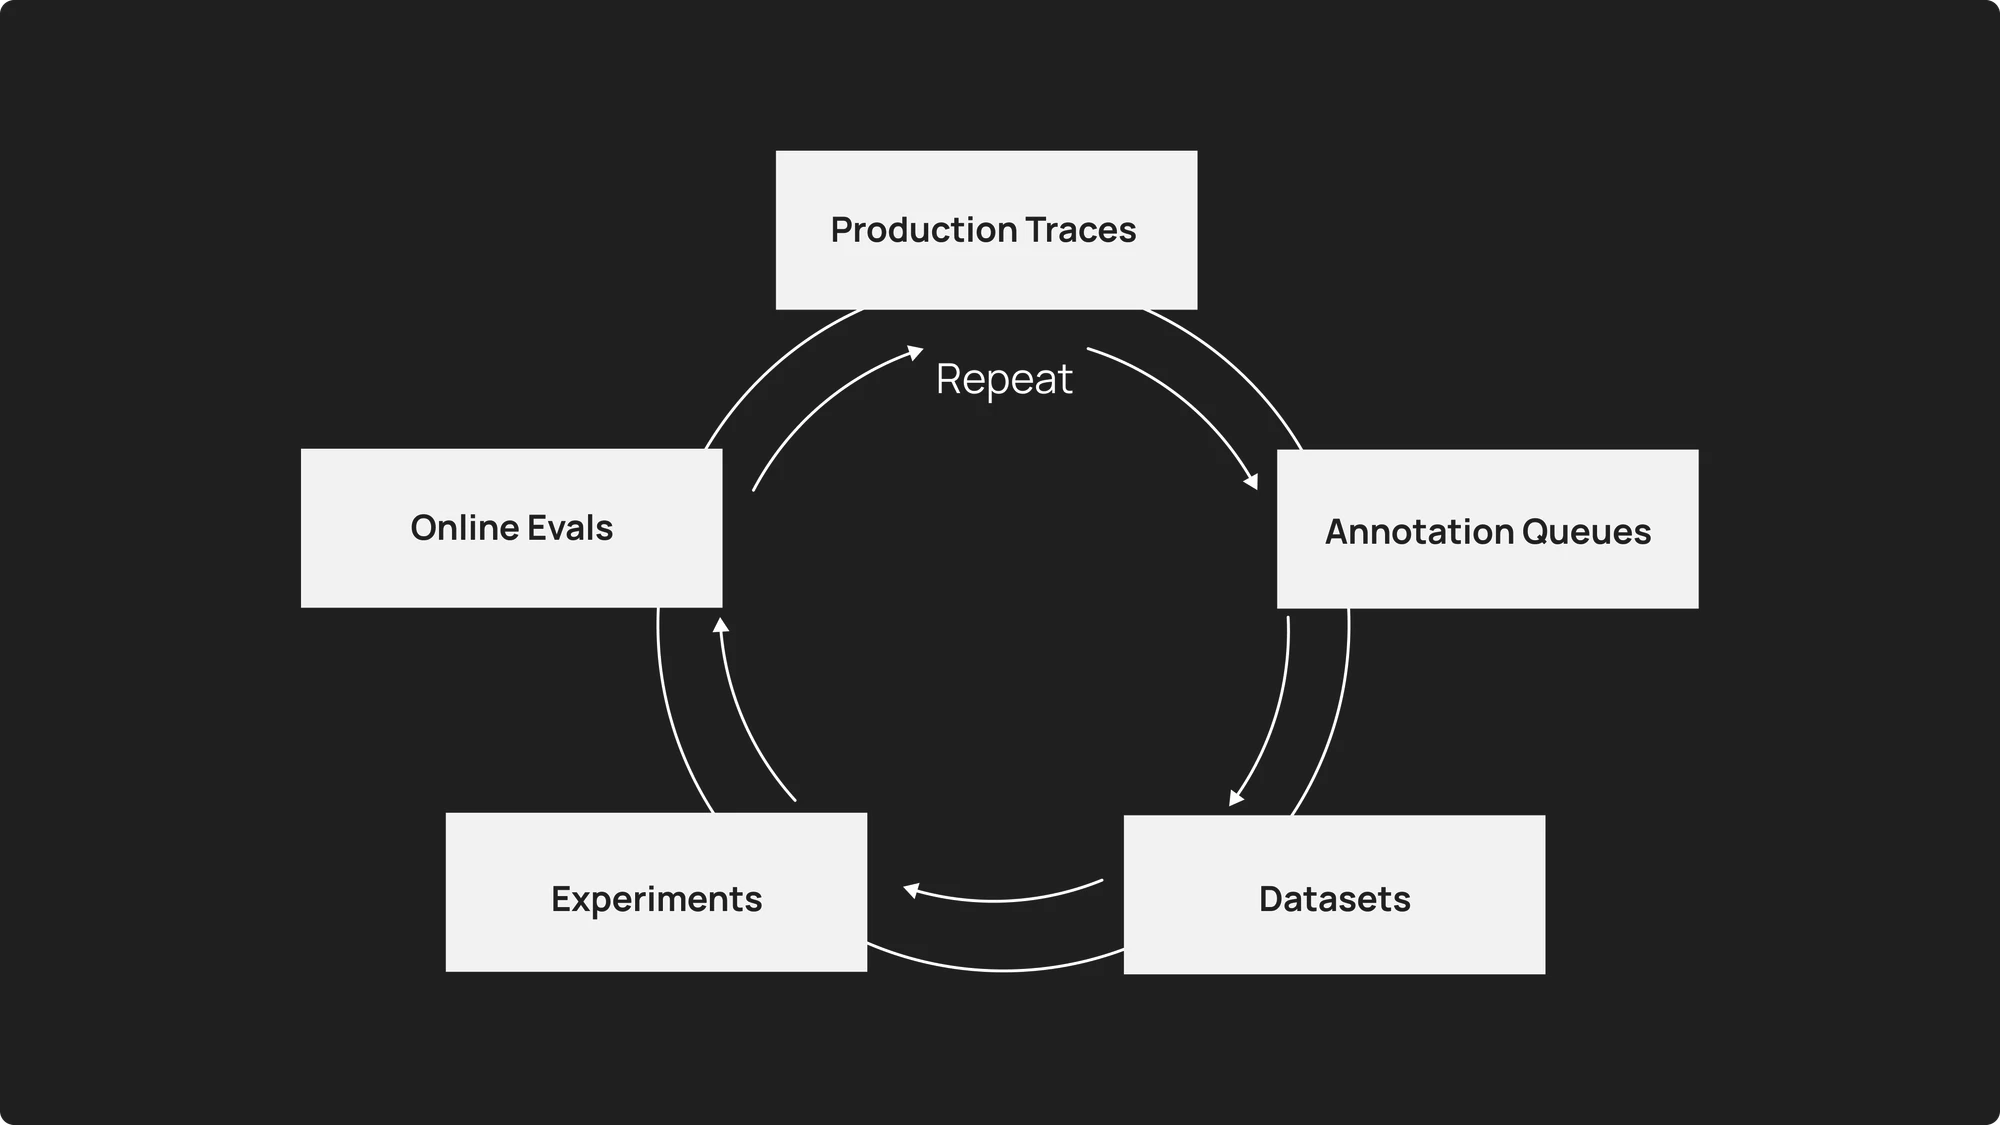
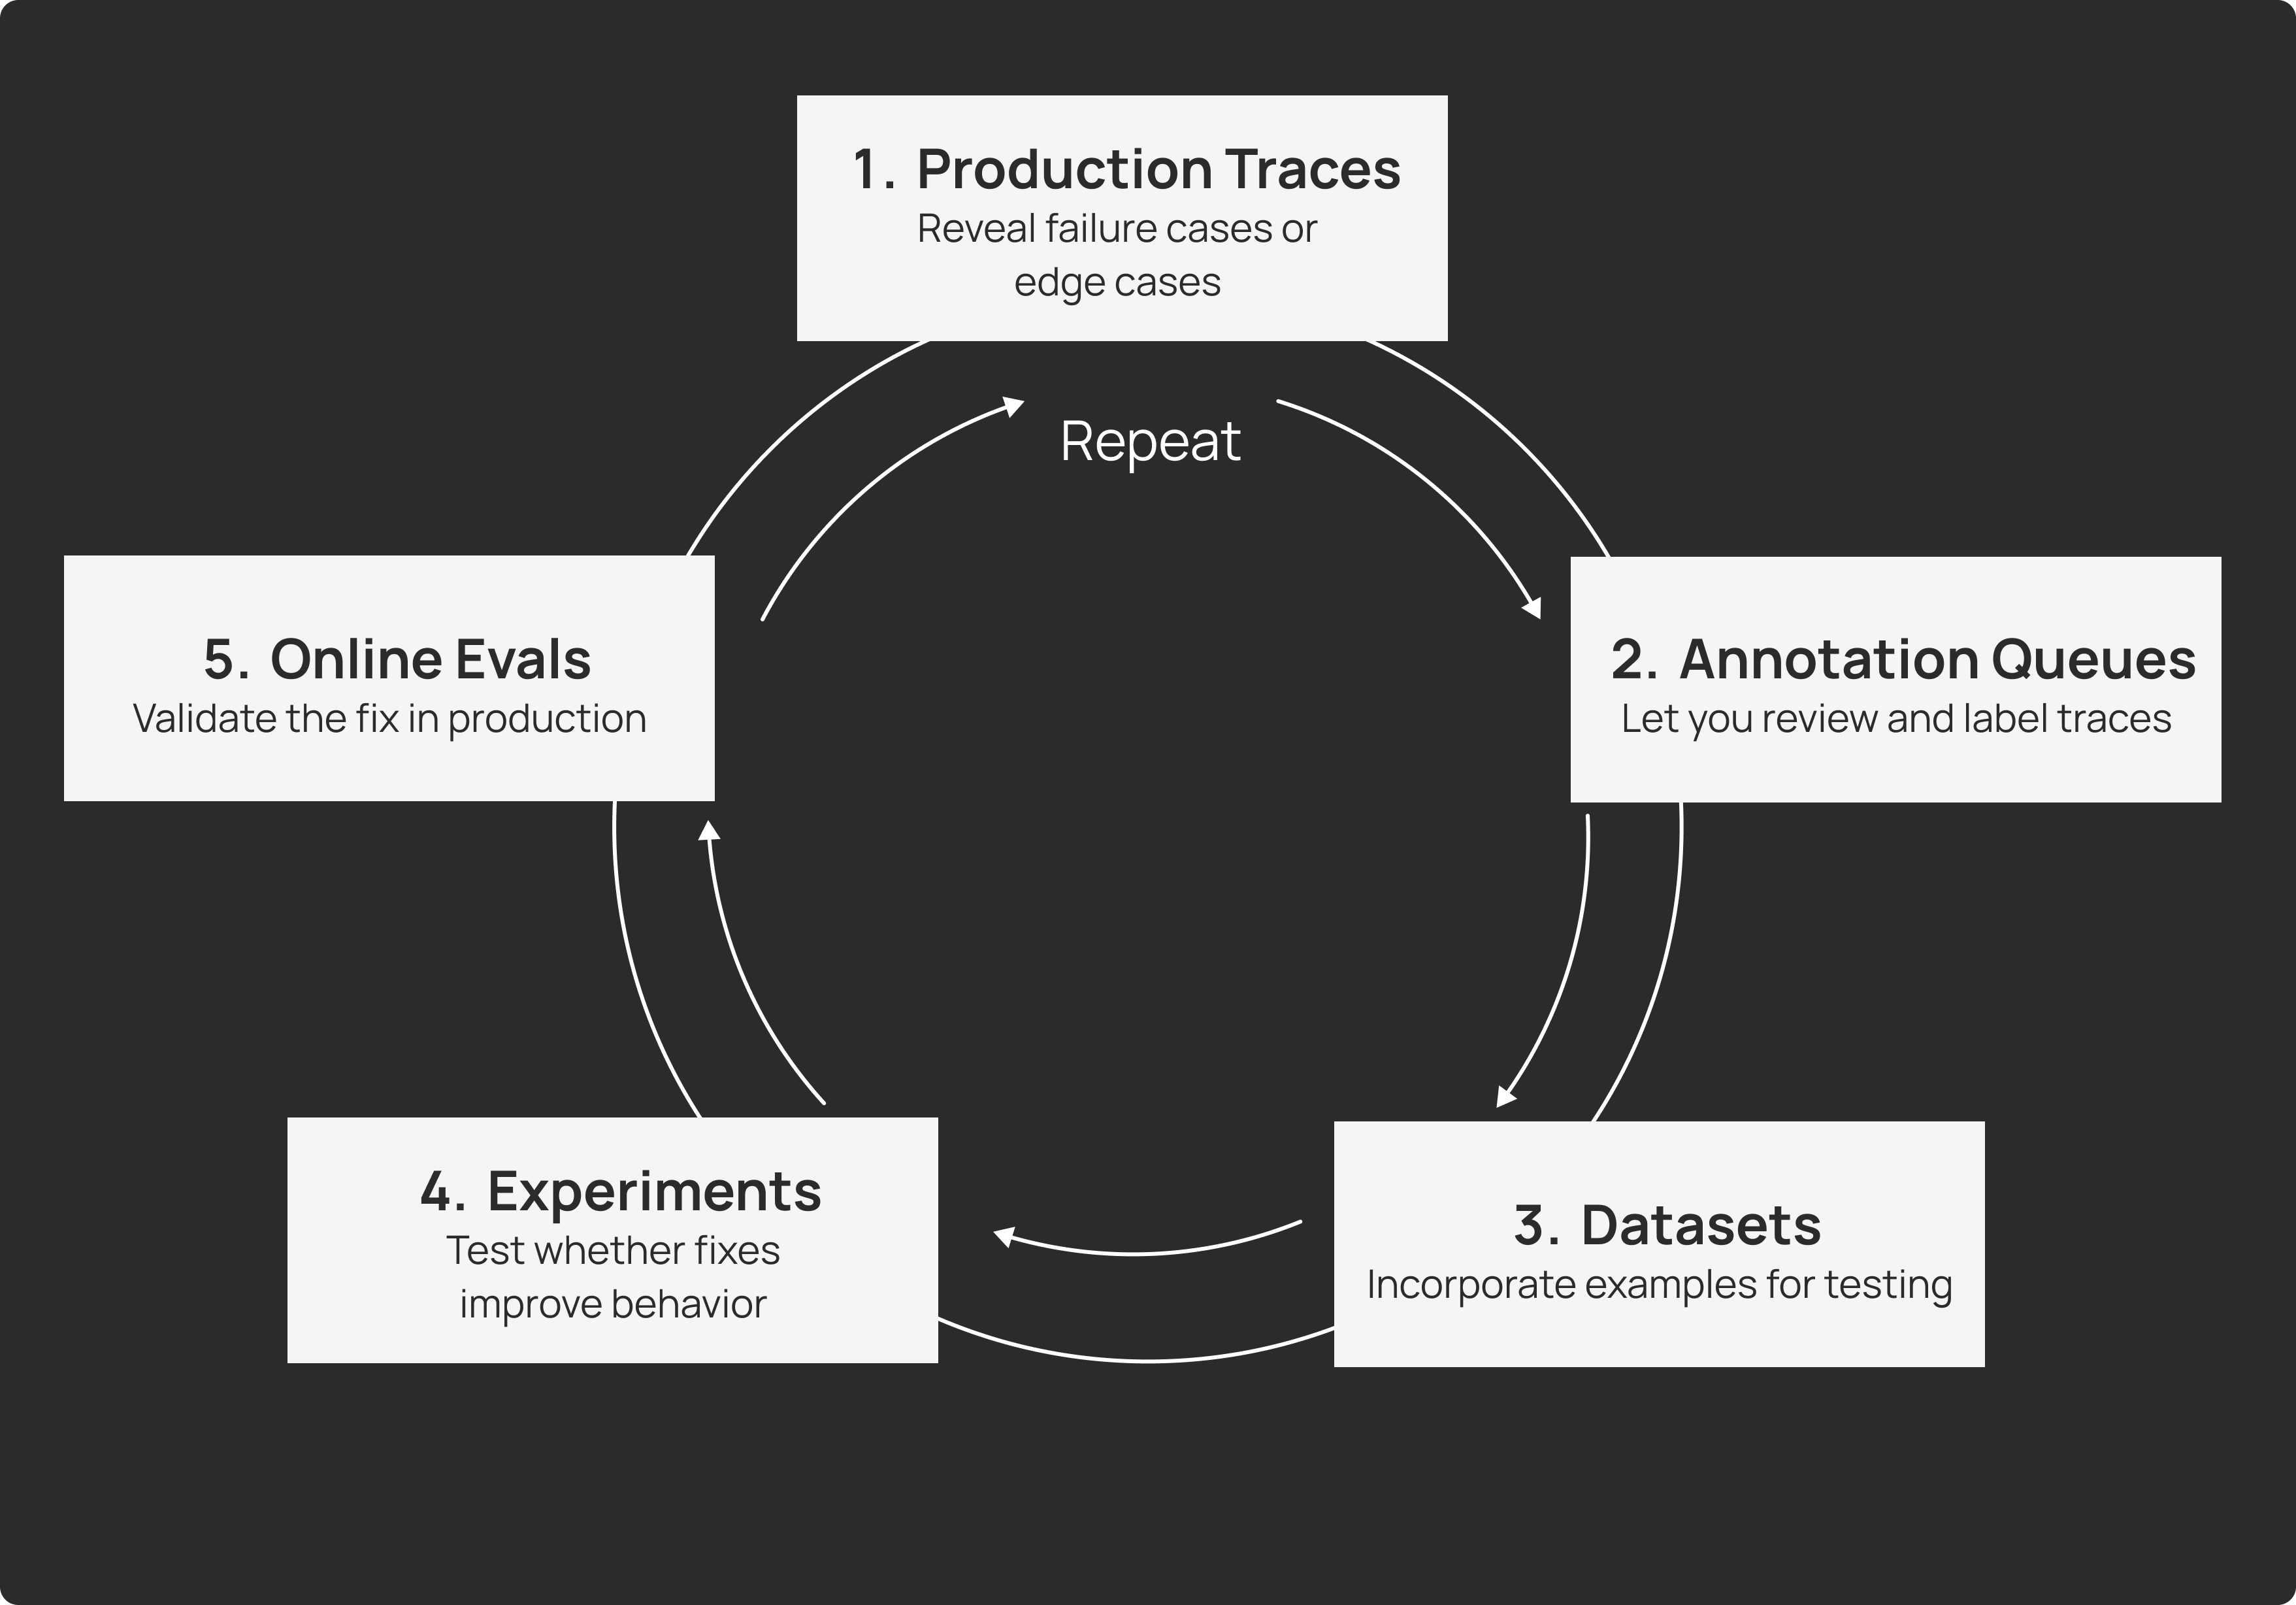
Connectivity: Integration with the development loop
Agent observability is deeply connected to the agent development workflow, where you should be continuously moving data between production monitoring, evaluation datasets, experimentation, and redeployment. The loop looks like:
- Production traces reveal failure cases or edge cases
- Annotation queues let you review and label them
- Datasets incorporate these examples for testing
- Experiments test whether fixes improve behavior
- Online evaluations validate the fix in production
This requires tight integration between your observability platform, your evaluation framework, and your development tools. Unlike traditional observability tools, LangSmith provides this connectivity. You can click a failing production trace and immediately add it to a dataset, modify your prompt in a playground environment, run an experiment comparing the old and new versions, and redeploy with confidence.
Users: Cross-functional teams
Finally, the people who need access to agent observability are different from those who typically use APM tools. Traditional observability is primarily for SRE and DevOps teams, who are focused on improving system health, performance regressions, and infrastructure issues.
Agent observability is for cross-functional teams, including:
- AI/ML engineers debugging prompt issues and model behavior
- Product managers understanding usage patterns and feature requests
- Subject matter experts (SMEs) reviewing accuracy and quality in specialized areas
- Data scientists analyzing patterns and building evaluations
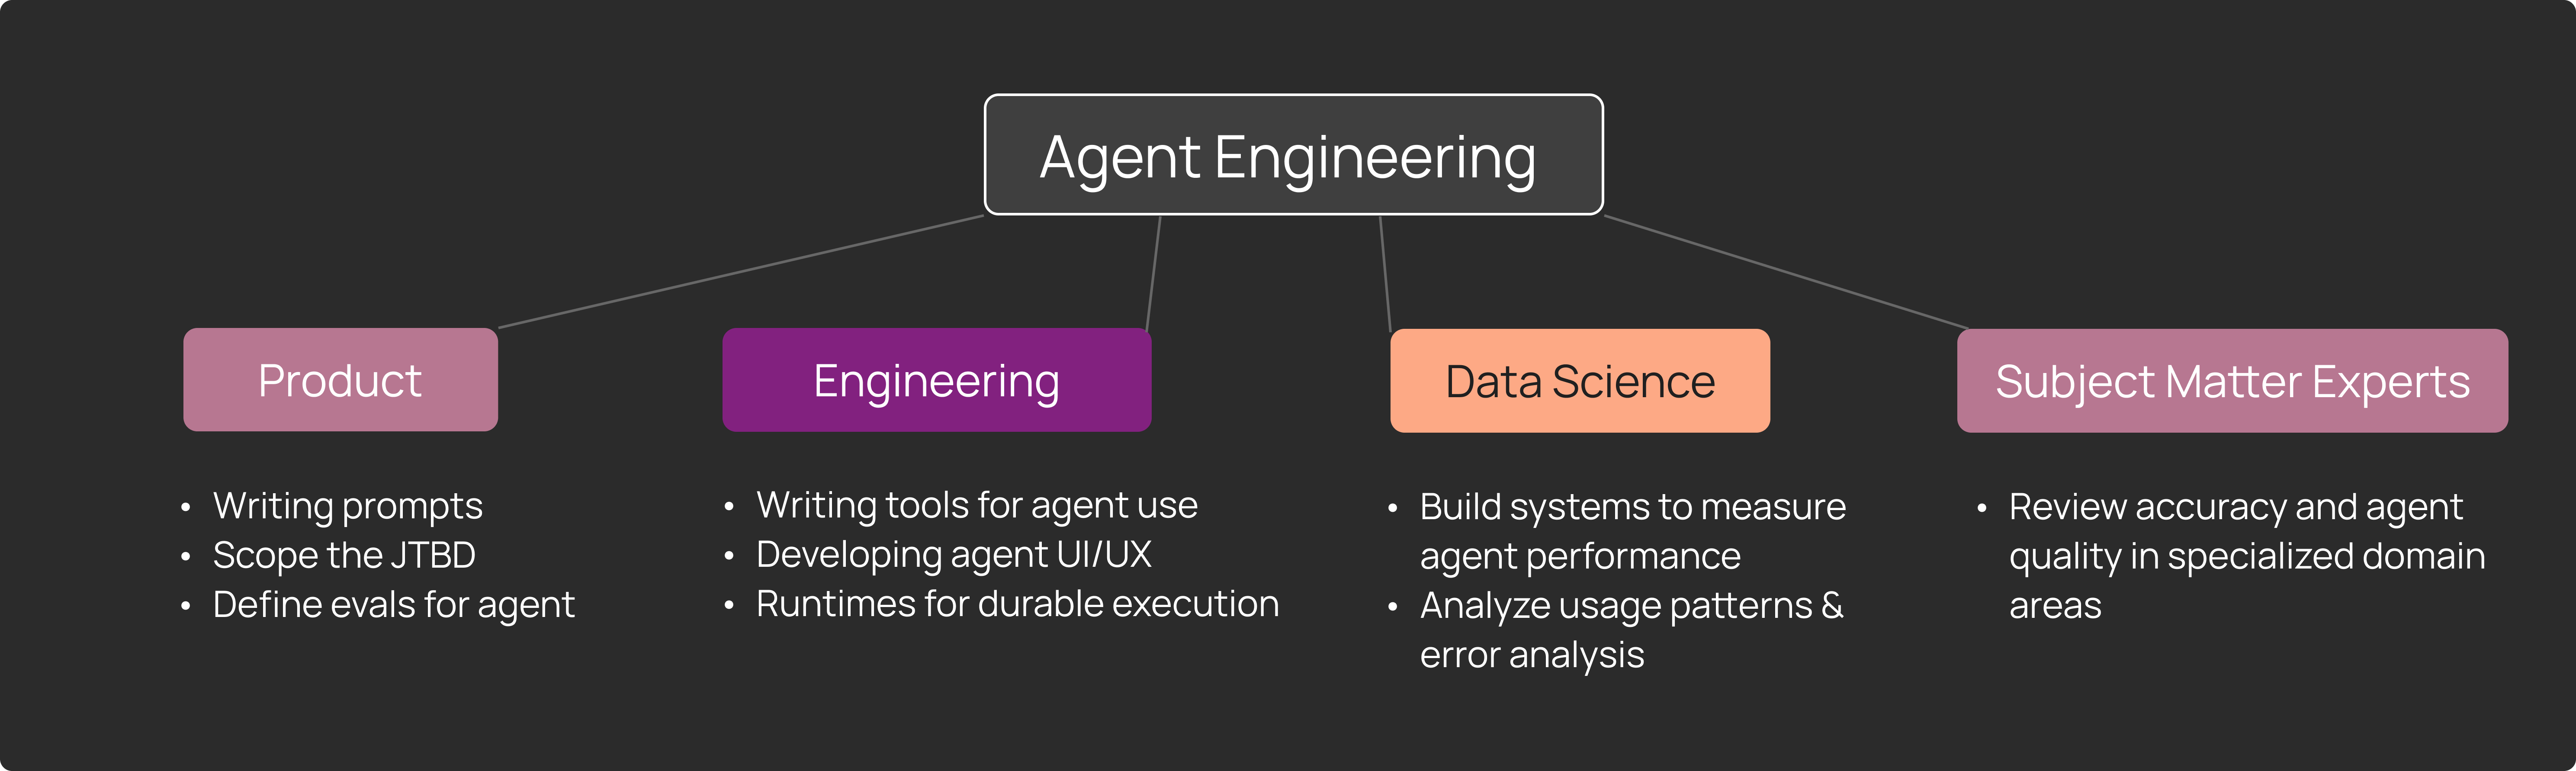
We've observed that agent observability becomes central to how these teams work together to improve the user experience. They regularly do data reviews of production traces, discuss patterns, and make decisions about priorities based on what they observe.
This requires an interface and workflow designed for collaboration across these personas, not just for infrastructure engineers.
Open challenges
While the approaches we've described have proven effective for teams deploying agents at scale, significant challenges remain:
- Evaluator accuracy and reliability: LLM evaluators continue to improve as models get better, but they aren’t perfect. Understanding when to trust automated evaluation versus requiring human review remains context-dependent.
- Cost at scale: Comprehensive monitoring of high-volume production systems can be expensive. Finding the right balance of sampling, automated evaluation, and human review is an ongoing optimization.
- Privacy and compliance: Capturing full prompt-response pairs while respecting privacy constraints and handling sensitive data appropriately adds complexity to observability infrastructure.
Conclusion
Agents operate differently from traditional software. They accept natural language inputs, exhibit non-deterministic behavior, and make decisions through complex reasoning chains. These characteristics shift the focus of production monitoring from system metrics to the actual inputs and outputs themselves.
The approaches we've described (structured annotation queues, automated pattern discovery, and continuous evaluation) represent our current thinking on how to make production agent behavior observable and improvable at scale. We built LangSmith to address these requirements based on patterns we observed working with teams deploying agents.
If you're working on agent observability, we'd be interested to hear what approaches you've found effective. Learn more about LangSmith Observability or read our documentation.
Additional Reading
Learn how:
- Monday uses online evaluations to monitor their customer-facing agents
- Appfolio leverages LangSmith to monitor and pinpoint issues in production
- Podium collects user feedback and performs online evals to improve response quality
- Jimdo monitors agent metrics including quality scores and tool quality output