State of Agent Engineering
We surveyed over 1,300 professionals — from engineers and product managers to business leaders and executives — to uncover the state of AI agents. Let’s dive into the data and break down how AI agents are being used (or not) today.
12 June, 2026
Introduction
As we enter 2026, organizations are no longer asking whether to build agents, but rather how to deploy them reliably, efficiently, and at scale. We surveyed 1,300+ professionals to understand how they are evolving their AI agent use cases and handling agent engineering challenges.
Key findings:
- Production momentum is real, with 57% of respondents having agents in production, with large enterprises leading in adoption
- Quality is the production killer, with 32% citing it as a top barrier. Meanwhile, cost concerns dropped from last year
- Observability is table stakes. Nearly 89% of respondents have implemented observability for their agents, outpacing evals adoption at 52%.
- Using multiple models is the norm. OpenAI leads with their GPT models but Gemini, Claude, and open source models see significant adoption. Fine-tuning has not been widely adopted.
Insights
What is agent engineering?
Agent engineering is the iterative process of harnessing LLMs into reliable systems. Because agents are non-deterministic, we believe engineers need to rapidly iterate to refine and improve agent quality.
Large enterprises are leading adoption
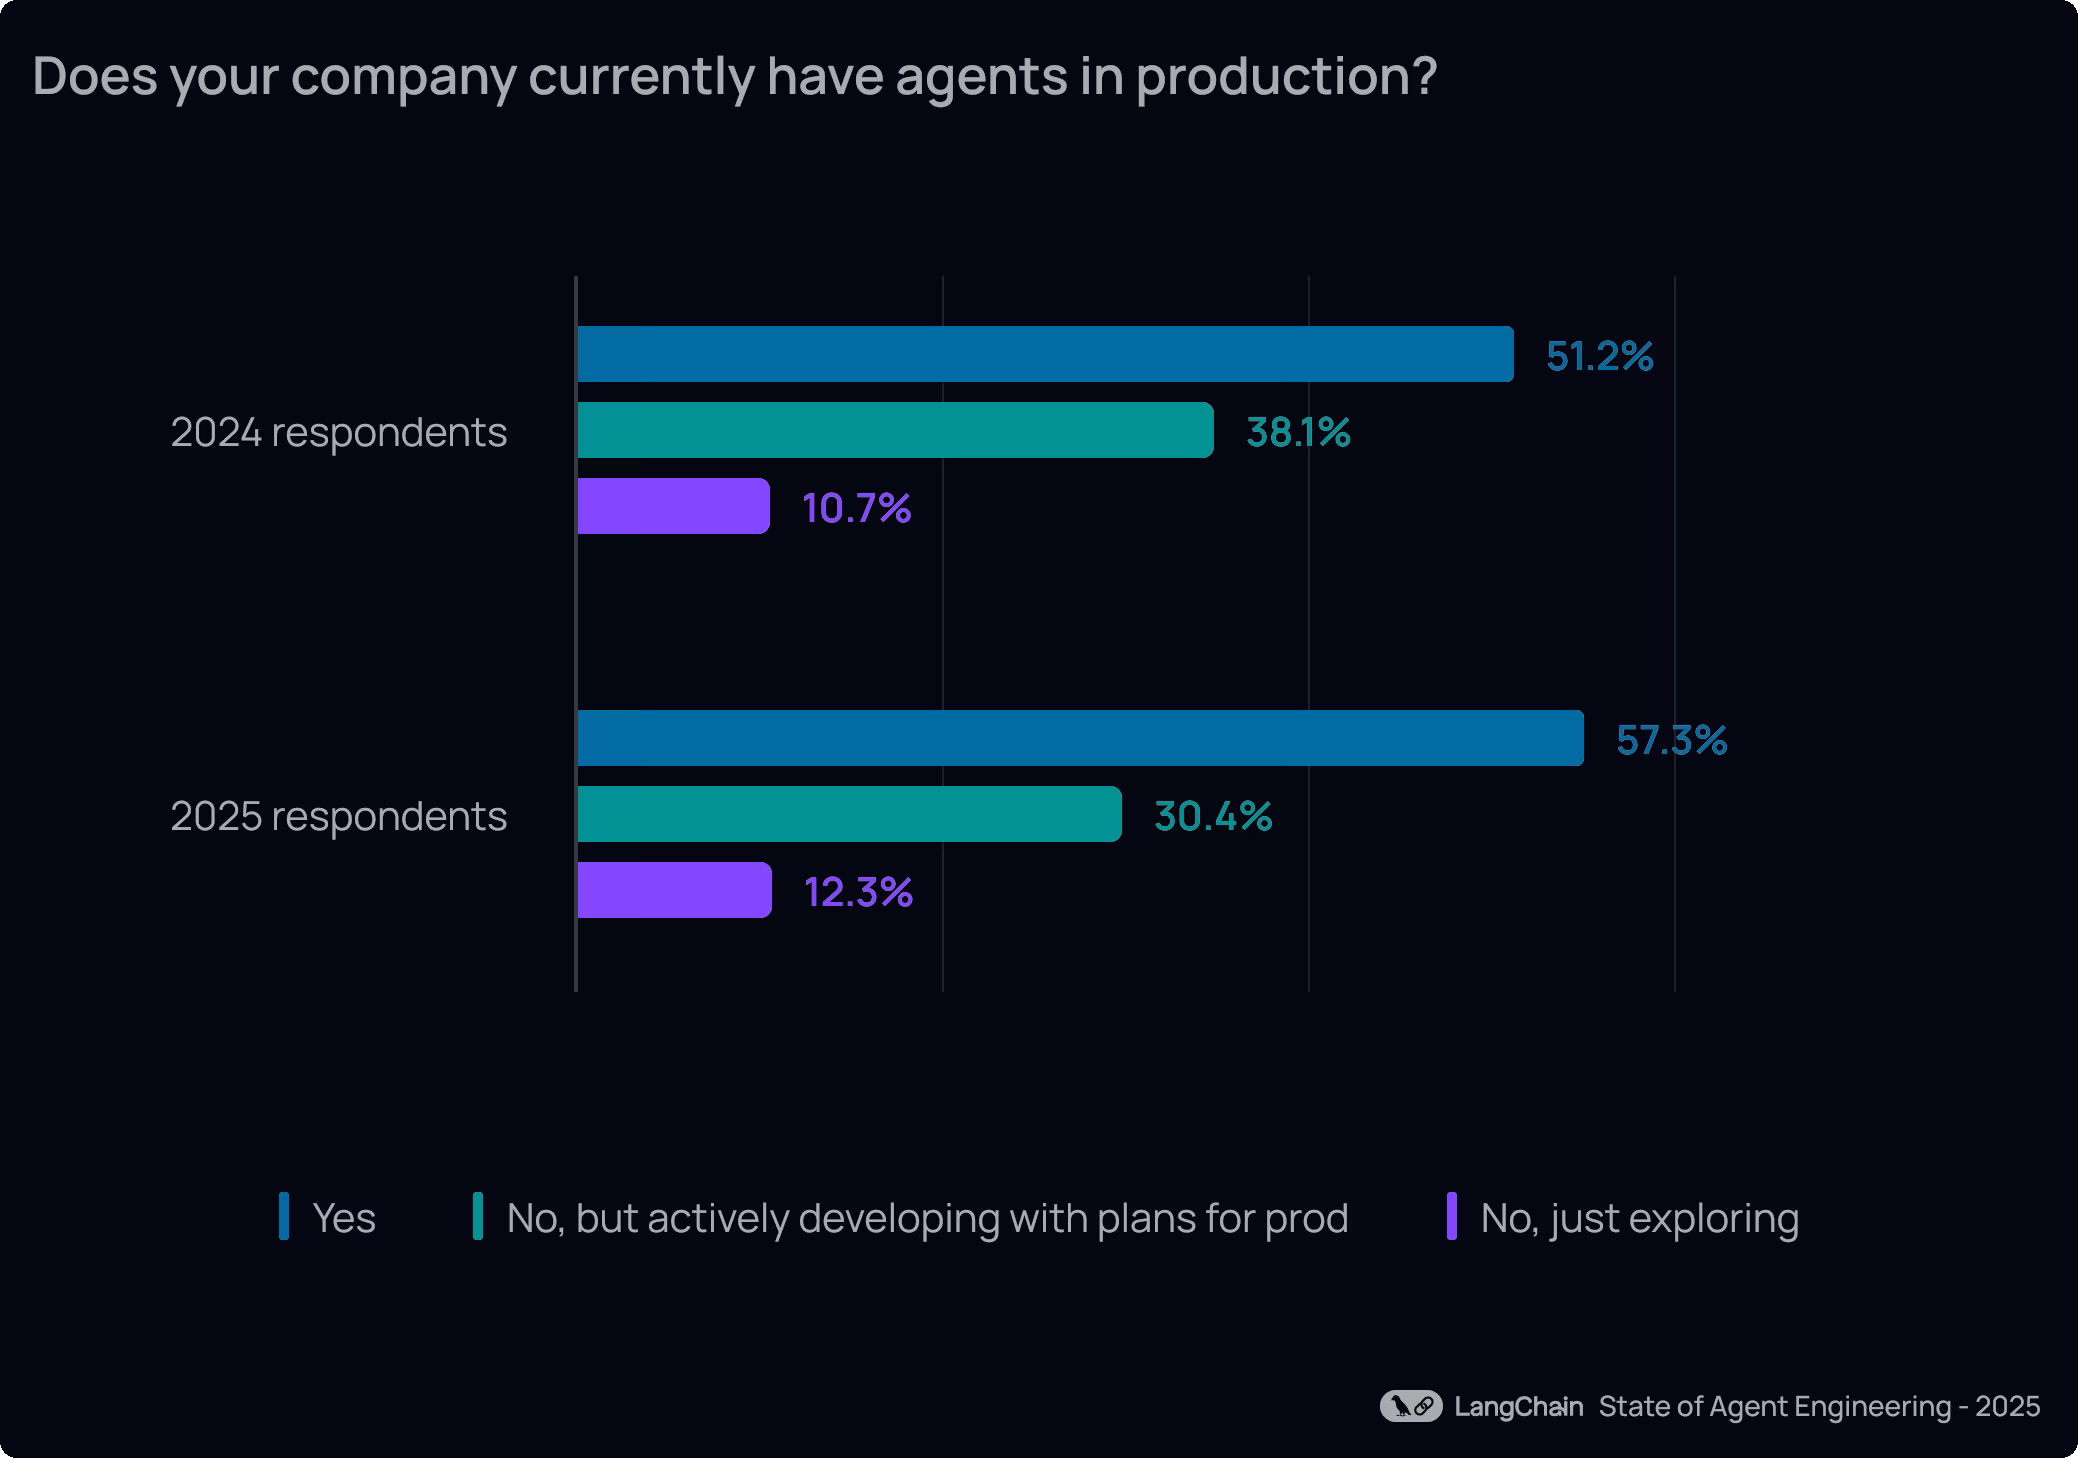
More than half of respondents surveyed (57.3%) now have agents running in production environments, with another 30.4% actively developing agents with concrete plans to deploy them.
This marks clear growth from last year’s survey, where 51% reported having agents in production. Organizations are moving past the proof-of-concept stage into production — the question for most organizations is no longer “if” they will ship agents but “how” and “when”.
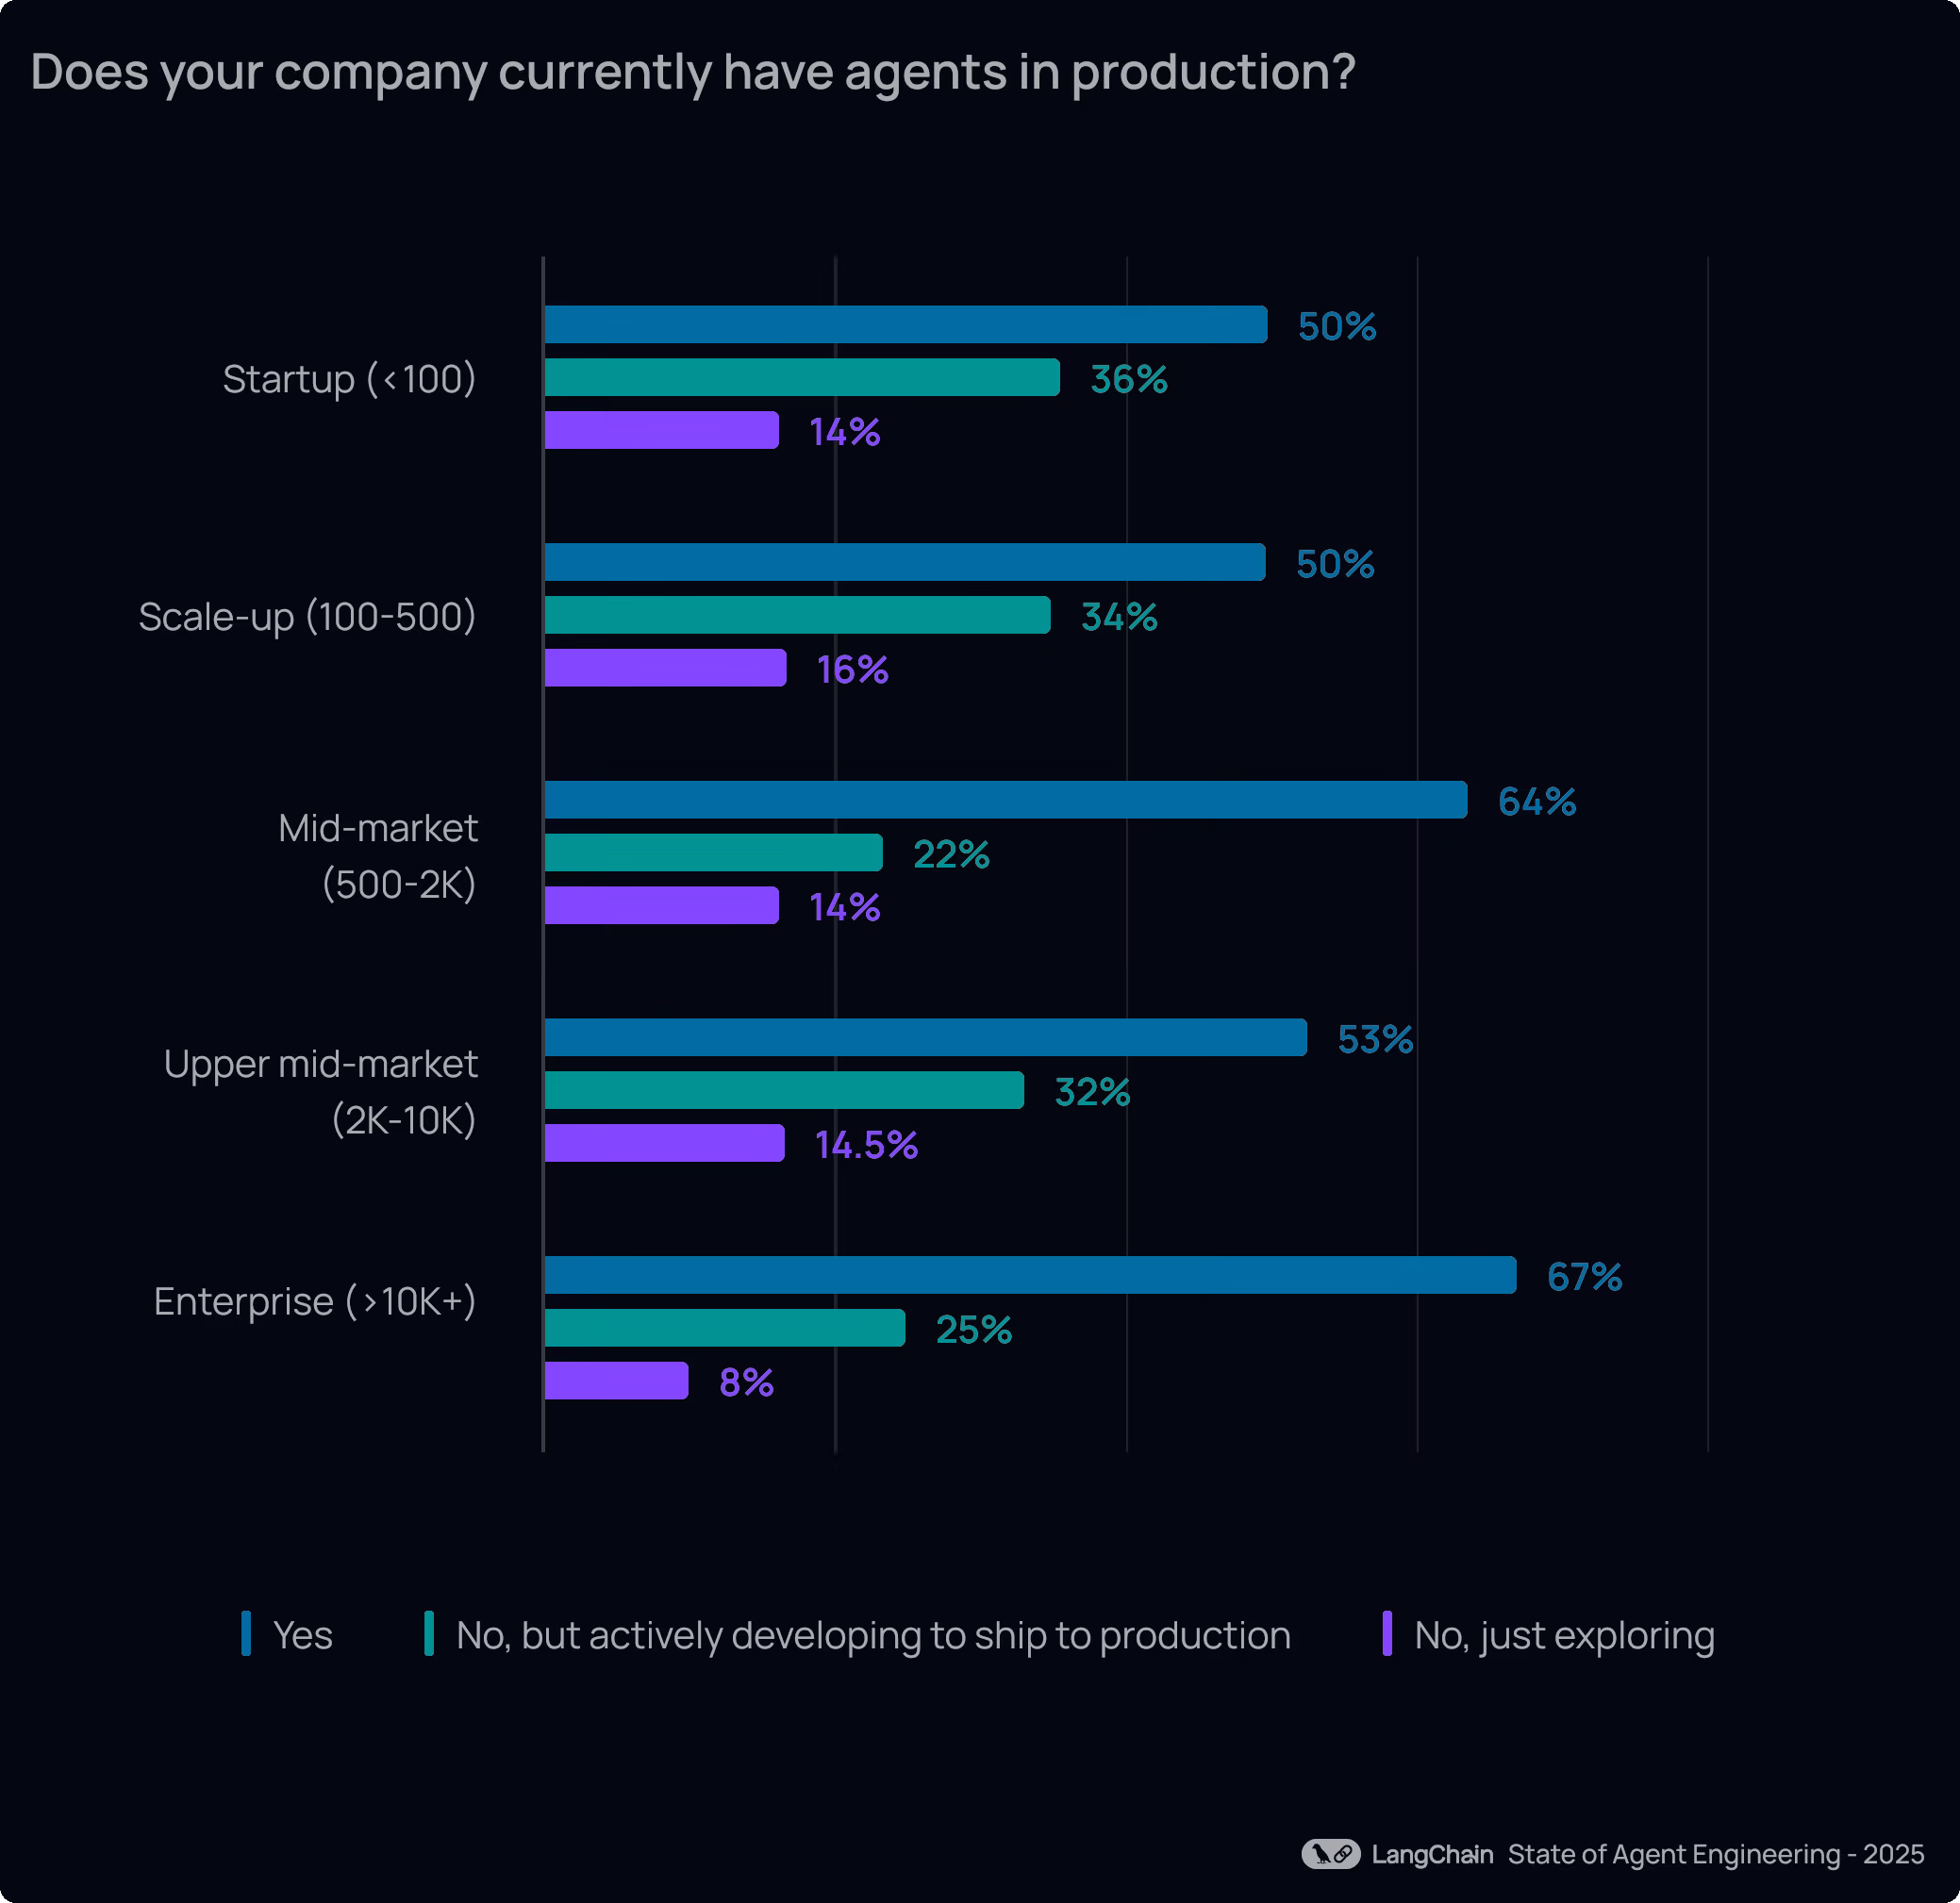
What changes at scale?
Of 10k+ size orgs, 67% had agents in production, with 24% actively developing with plans for production— versus for <100 size orgs, 50% had agents in production with 36% actively developing them. This suggest larger organizations are moving faster from pilots to durable systems, perhaps driven by greater investment in platform teams, security, and reliability infrastructure.
Leading agent use cases
Customer service emerged as the most common agent use case (26.5%), with research & data analysis close behind (24.4%). Together, these two categories represent more than half of all primary agent deployments.
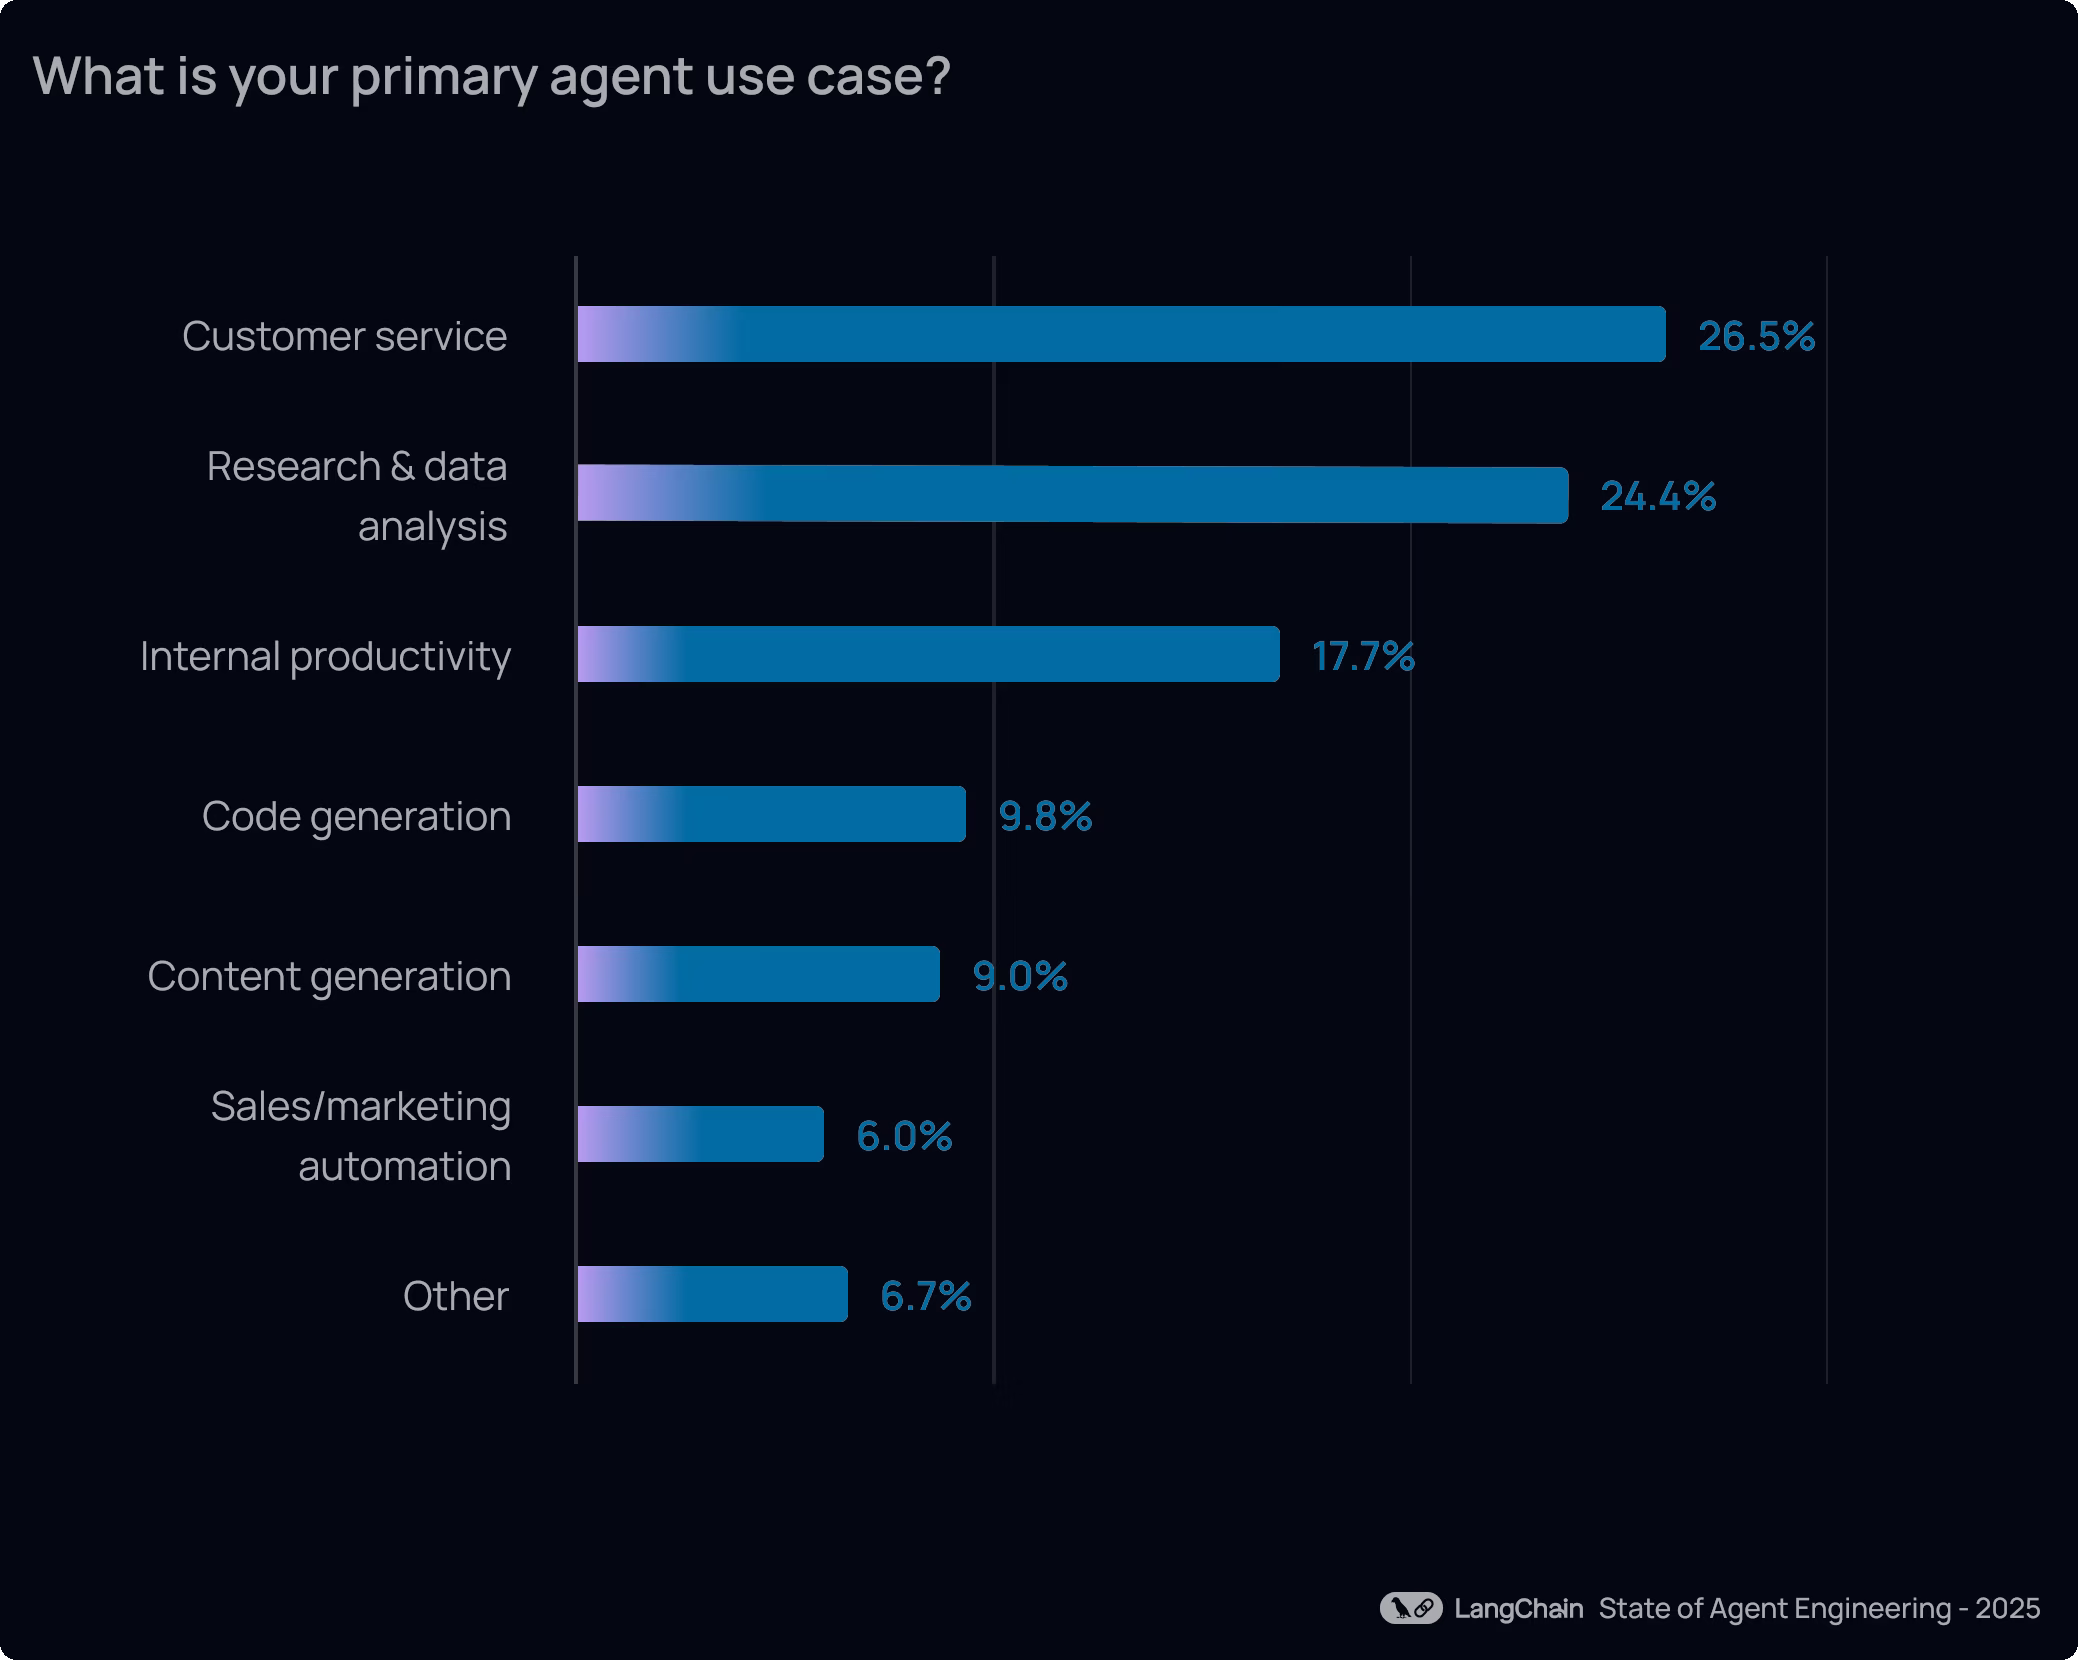
The strong showing of customer service suggests a shift toward teams putting agents directly in front of customers, not just using them internally. At the same time, agents continue to deliver clear value internally, with 18% citing using agents for internal workflow automation to boost employee efficiency.
The popularity of research & data analysis use cases further reinforces where agents shine today: synthesizing large volumes of information, reasoning across sources, and accelerating knowledge-intensive tasks.
Notably, we saw a greater spread of use cases selected by respondents this year (respondents could only select one primary use case), so agent adoption may be diversifying beyond a narrow set of early applications.
What changes at scale?
Among organizations with 10k+ employees, internal productivity is the top use case (26.8%), with customer service (24.7%) and research & data analysis (22.2%) close behind. Larger enterprises may tend to focus first on driving efficiency across internal teams before, or alongside, deploying agents directly to end users.
Biggest barriers to production
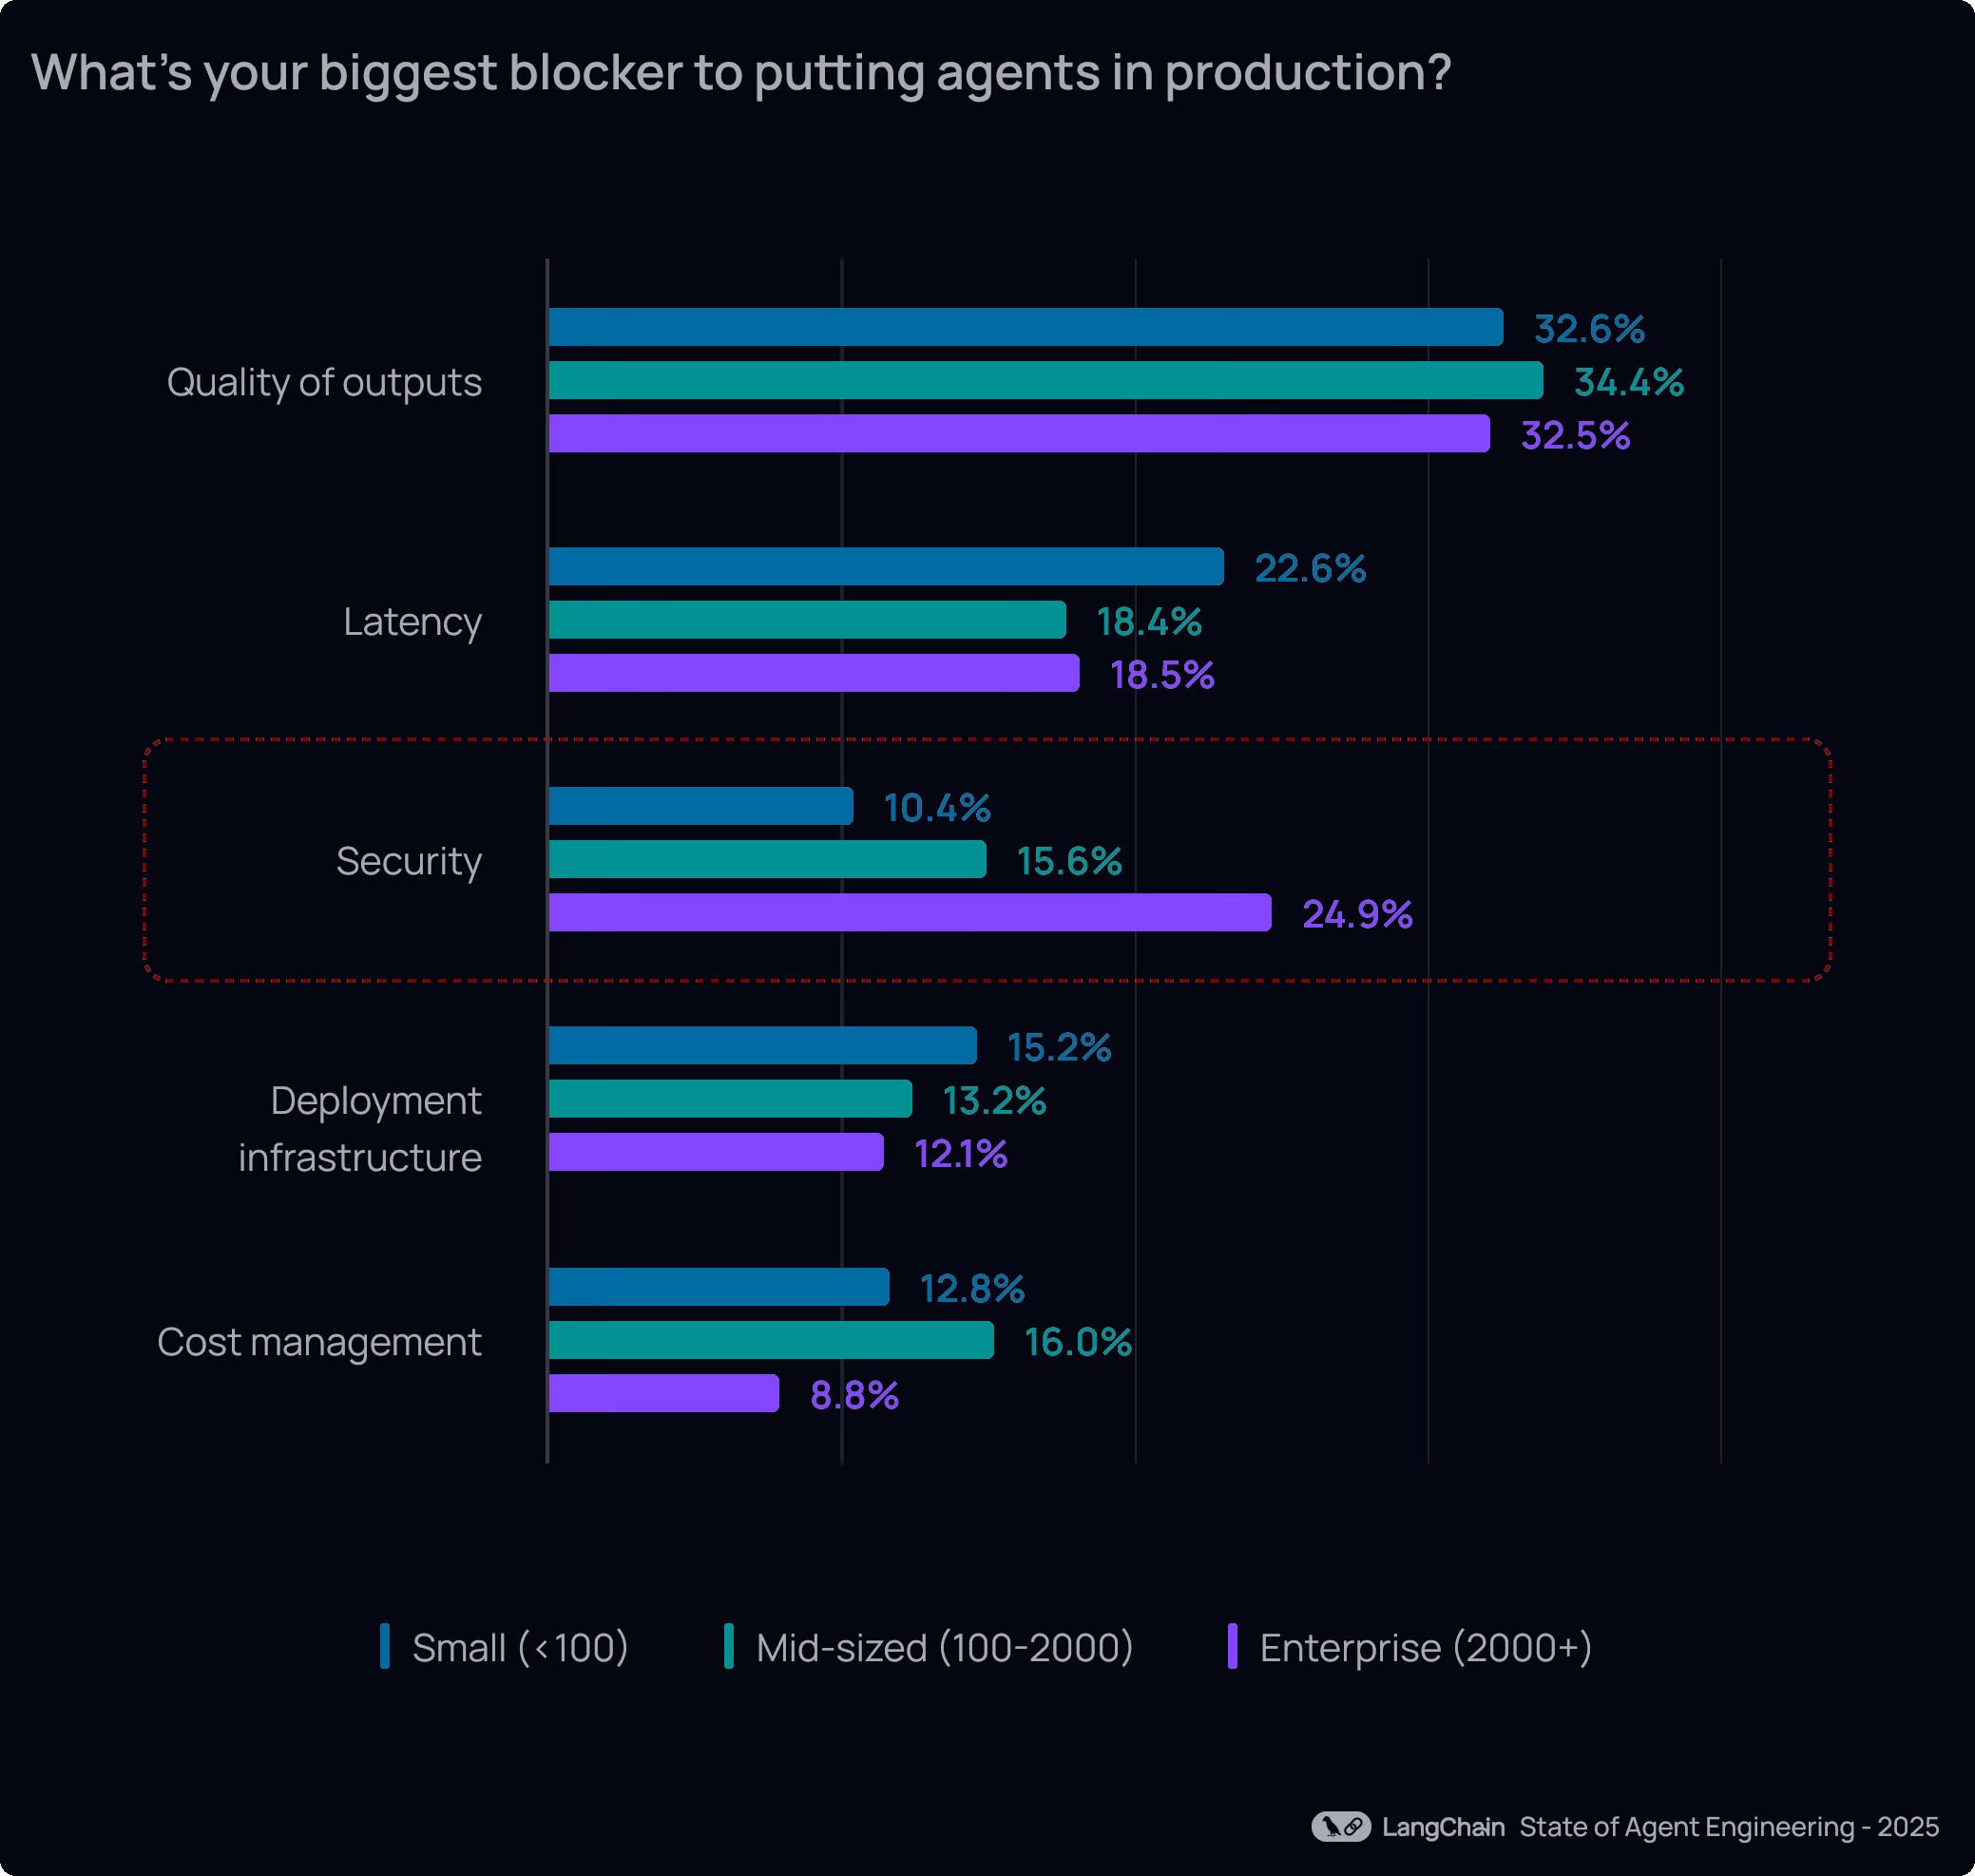
Quality remains the biggest barrier to production, consistent with last year’s findings. This year, one third of respondents cited quality as their primary blocker. This encompasses accuracy, relevance, consistency, and an agent’s ability to maintain the right tone and adhere to brand or policy guidelines.
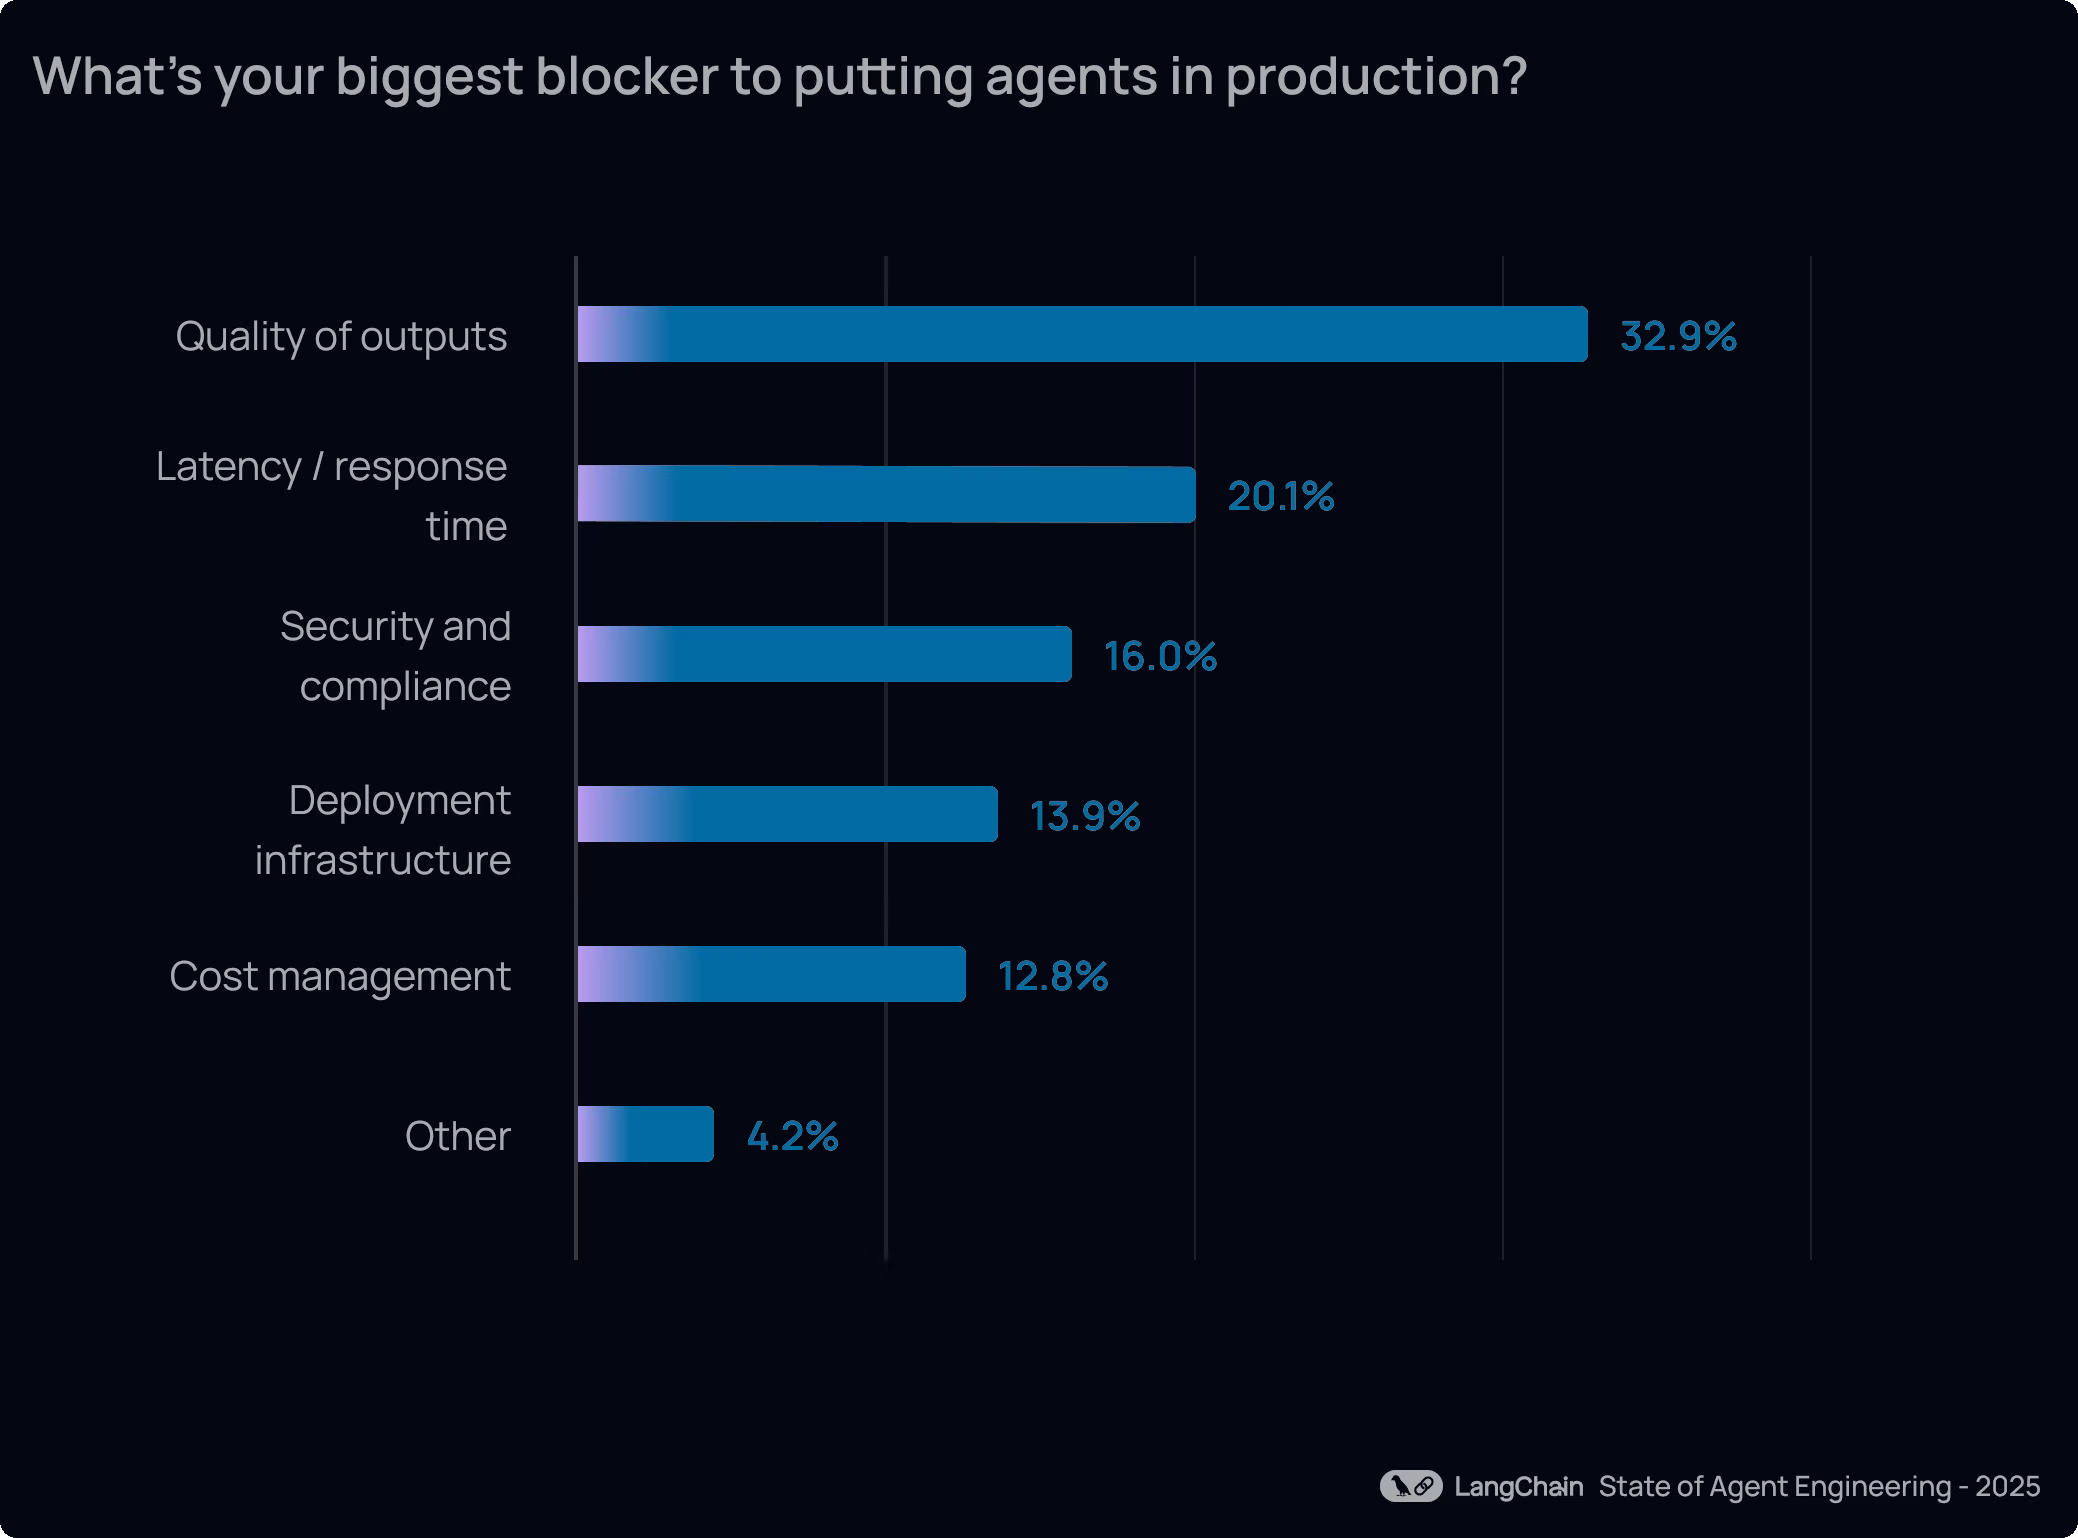
Latency has emerged as second biggest challenge (20%). As agents move into customer-facing use cases like customer service and code generation, response time becomes a critical part of the user experience. This also reflects the tradeoff between quality and speed for teams, as more capable, multi-step agents can deliver higher quality outputs but often with slower responses.
In contrast, cost is less frequently cited as a concern than in previous years. Falling model prices and improved efficiency appear to have shifted attention away from raw spend, with organizations prioritizing making agents work well and fast.
What changes at scale?
Among enterprises (2k+ employees), quality remains the top blocker but security emerges as the 2nd largest concern, cited by 24.9% of respondents — surpassing latency, which is more commonly a challenge for smaller organizations.
For orgs with 10k+ employees, write-in responses pointed to hallucinations and consistency of outputs generated by agent as the biggest challenge in ensuring agent quality. Many also cited ongoing difficulties with context engineering and managing context at scale.
Observability for agents
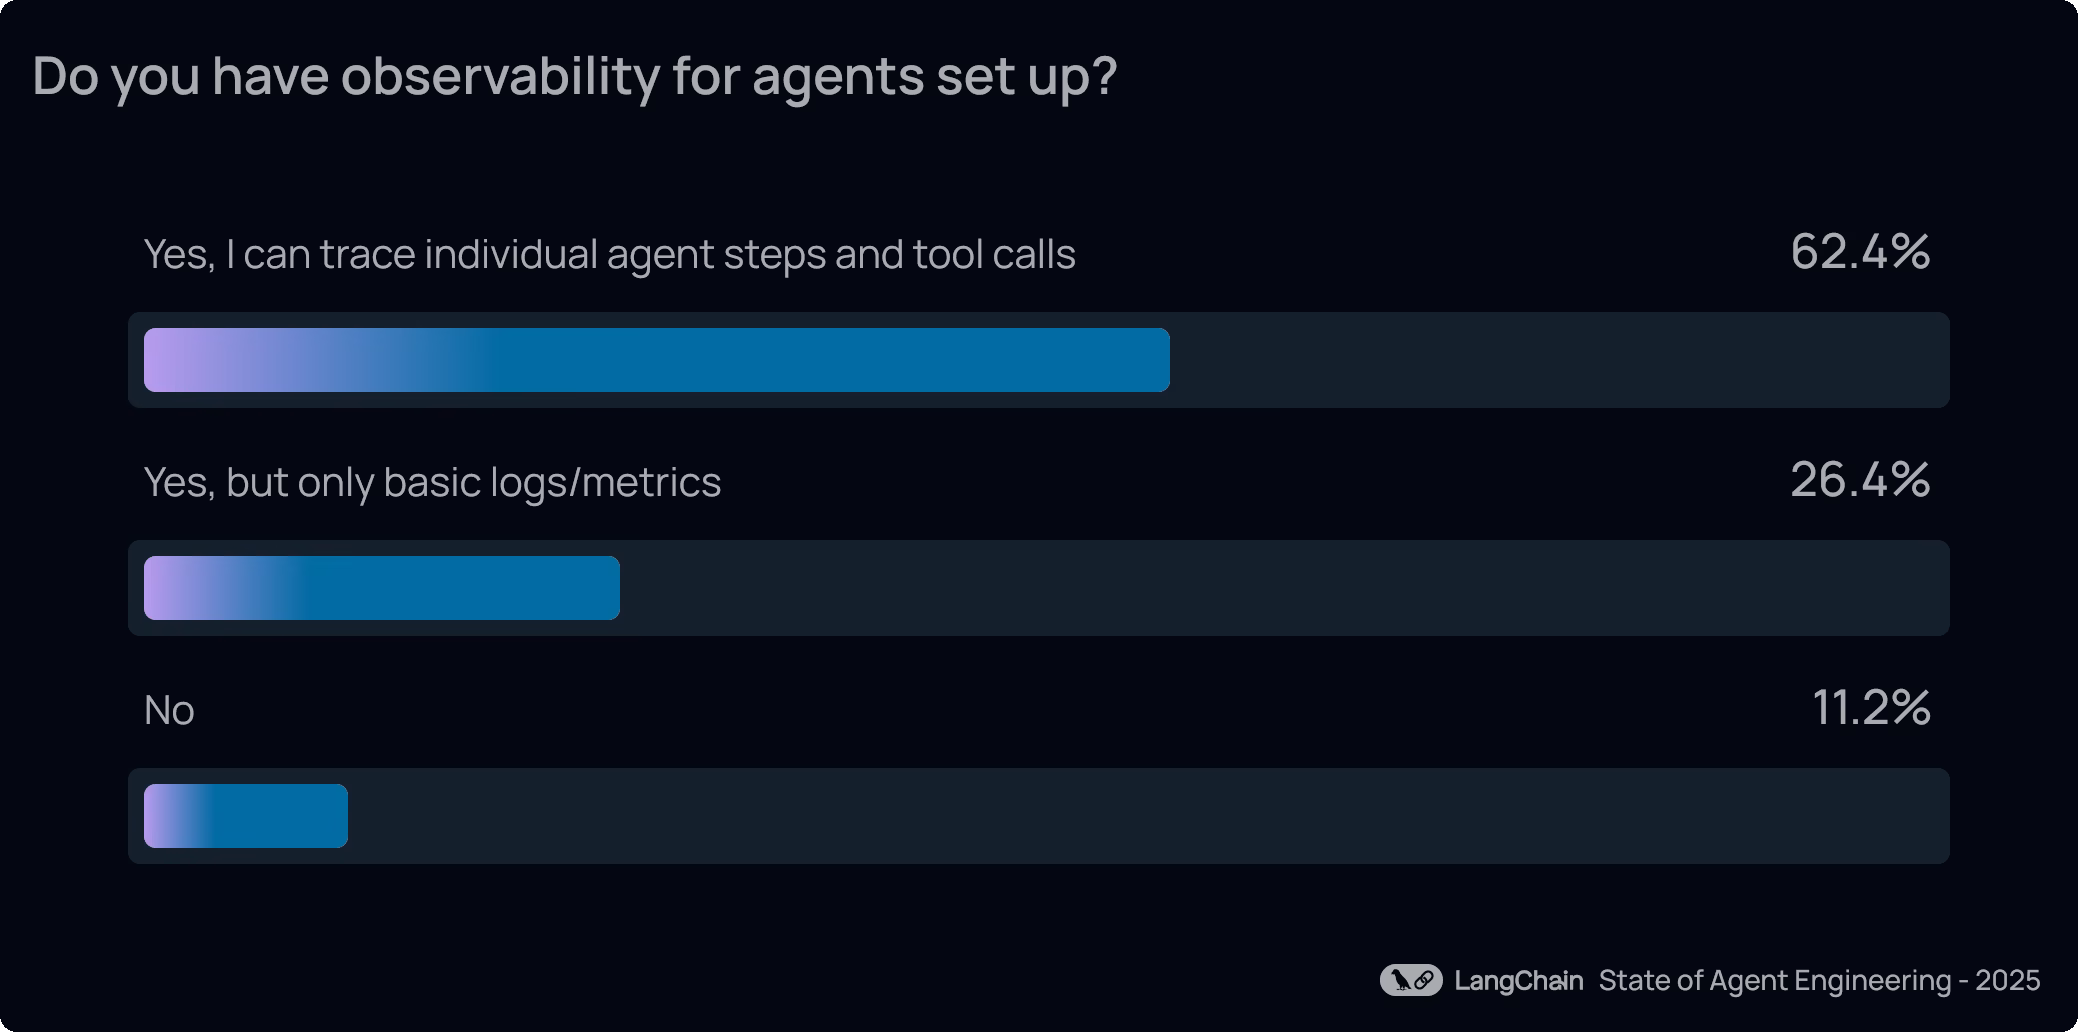
The ability to trace through multi-step reasoning chains and tool calls has become table stakes for agents. 89% of organizations have implemented some form of observability for their agents, and 62% have detailed tracing that allows them to inspect individual agent steps and tool calls.
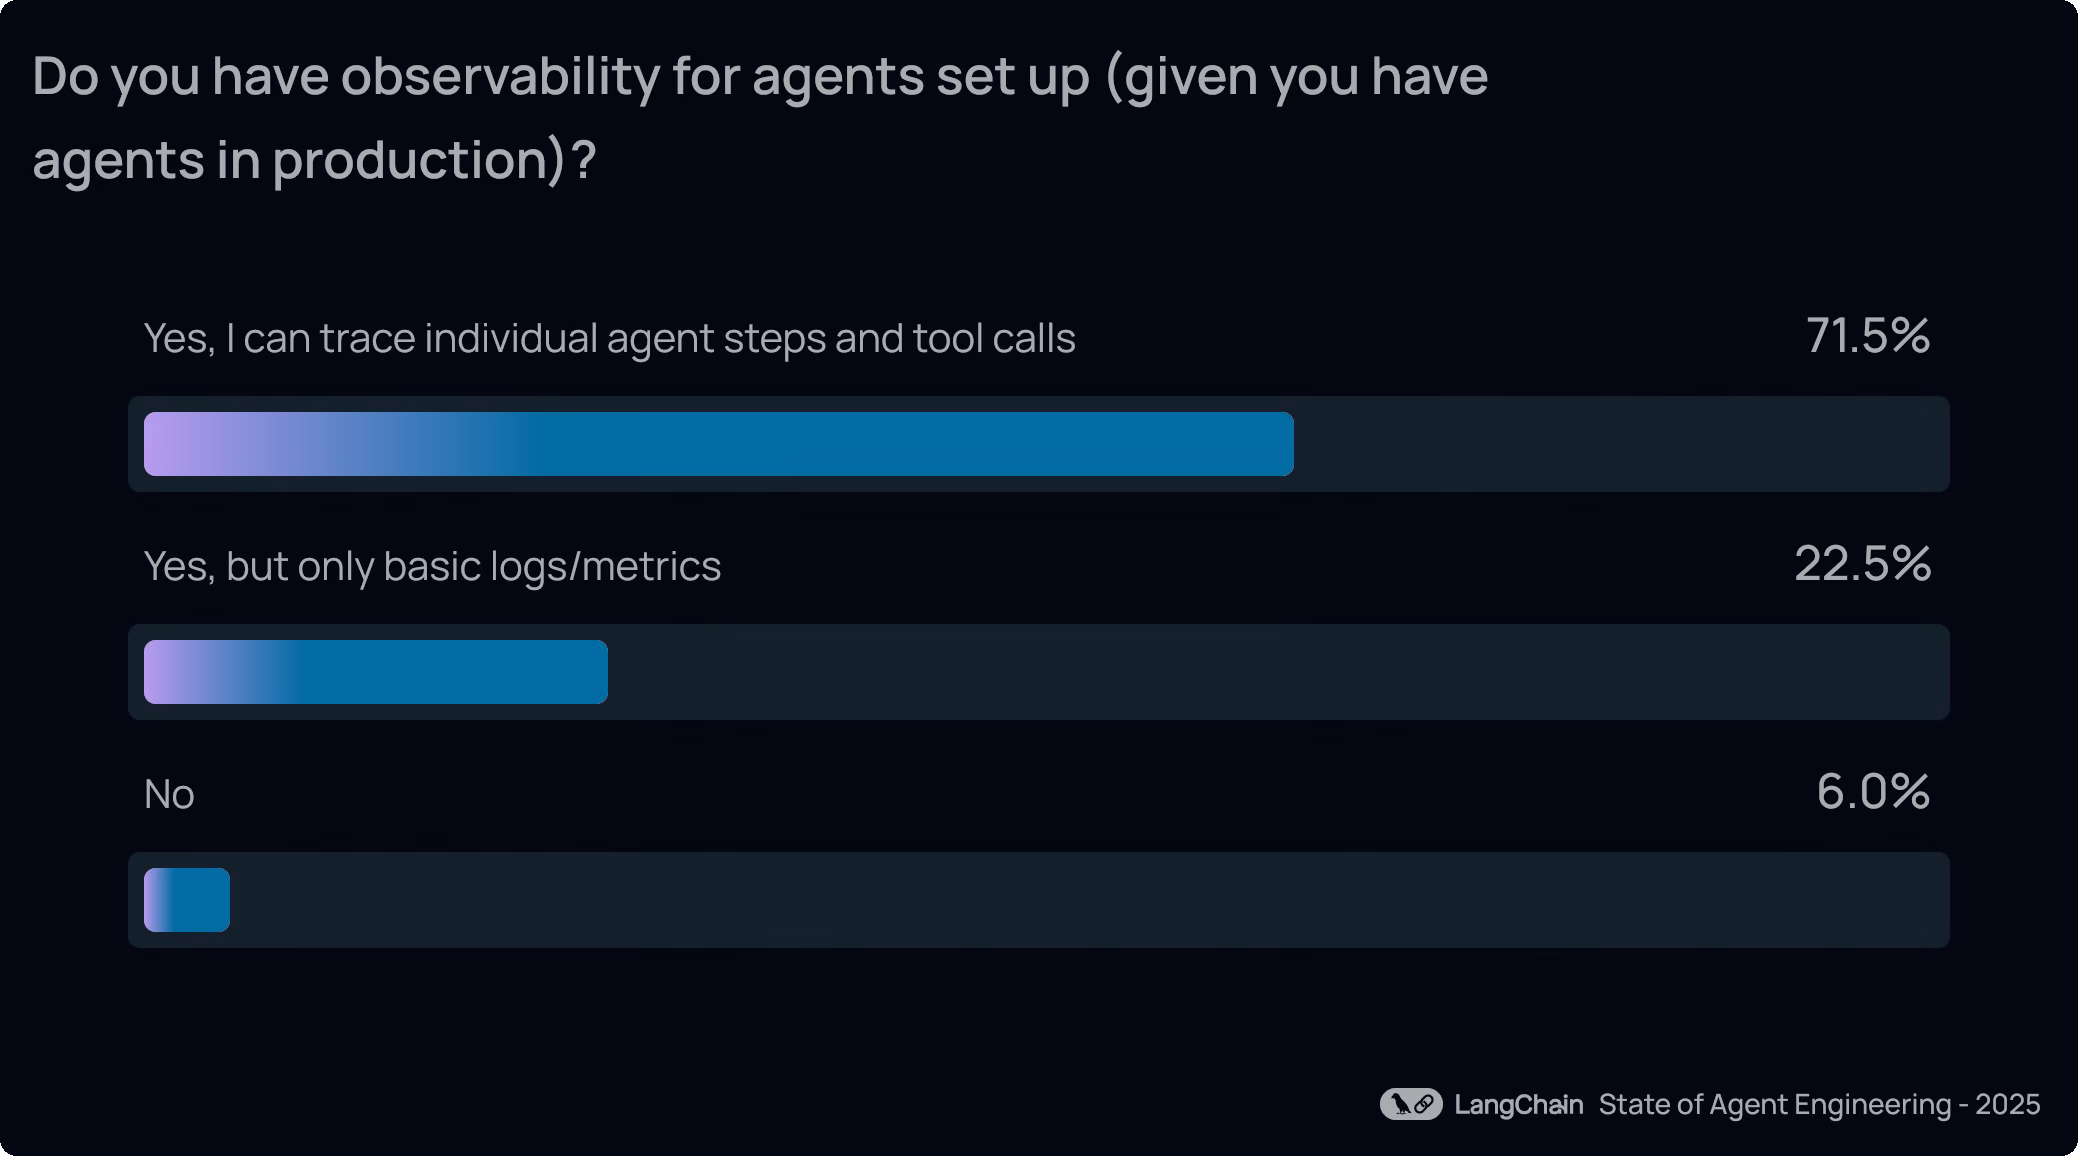
Adoption is even higher among respondents who already have agents in production: 94% have some form of observability in place, and 71.5% have full tracing capabilities. This speaks to a fundamental truth of agent engineering: without visibility into how an agent reasons and acts, teams can’t reliably debug failures, optimize performance, or build trust with internal and external stakeholders.
Evaluation and testing for agents
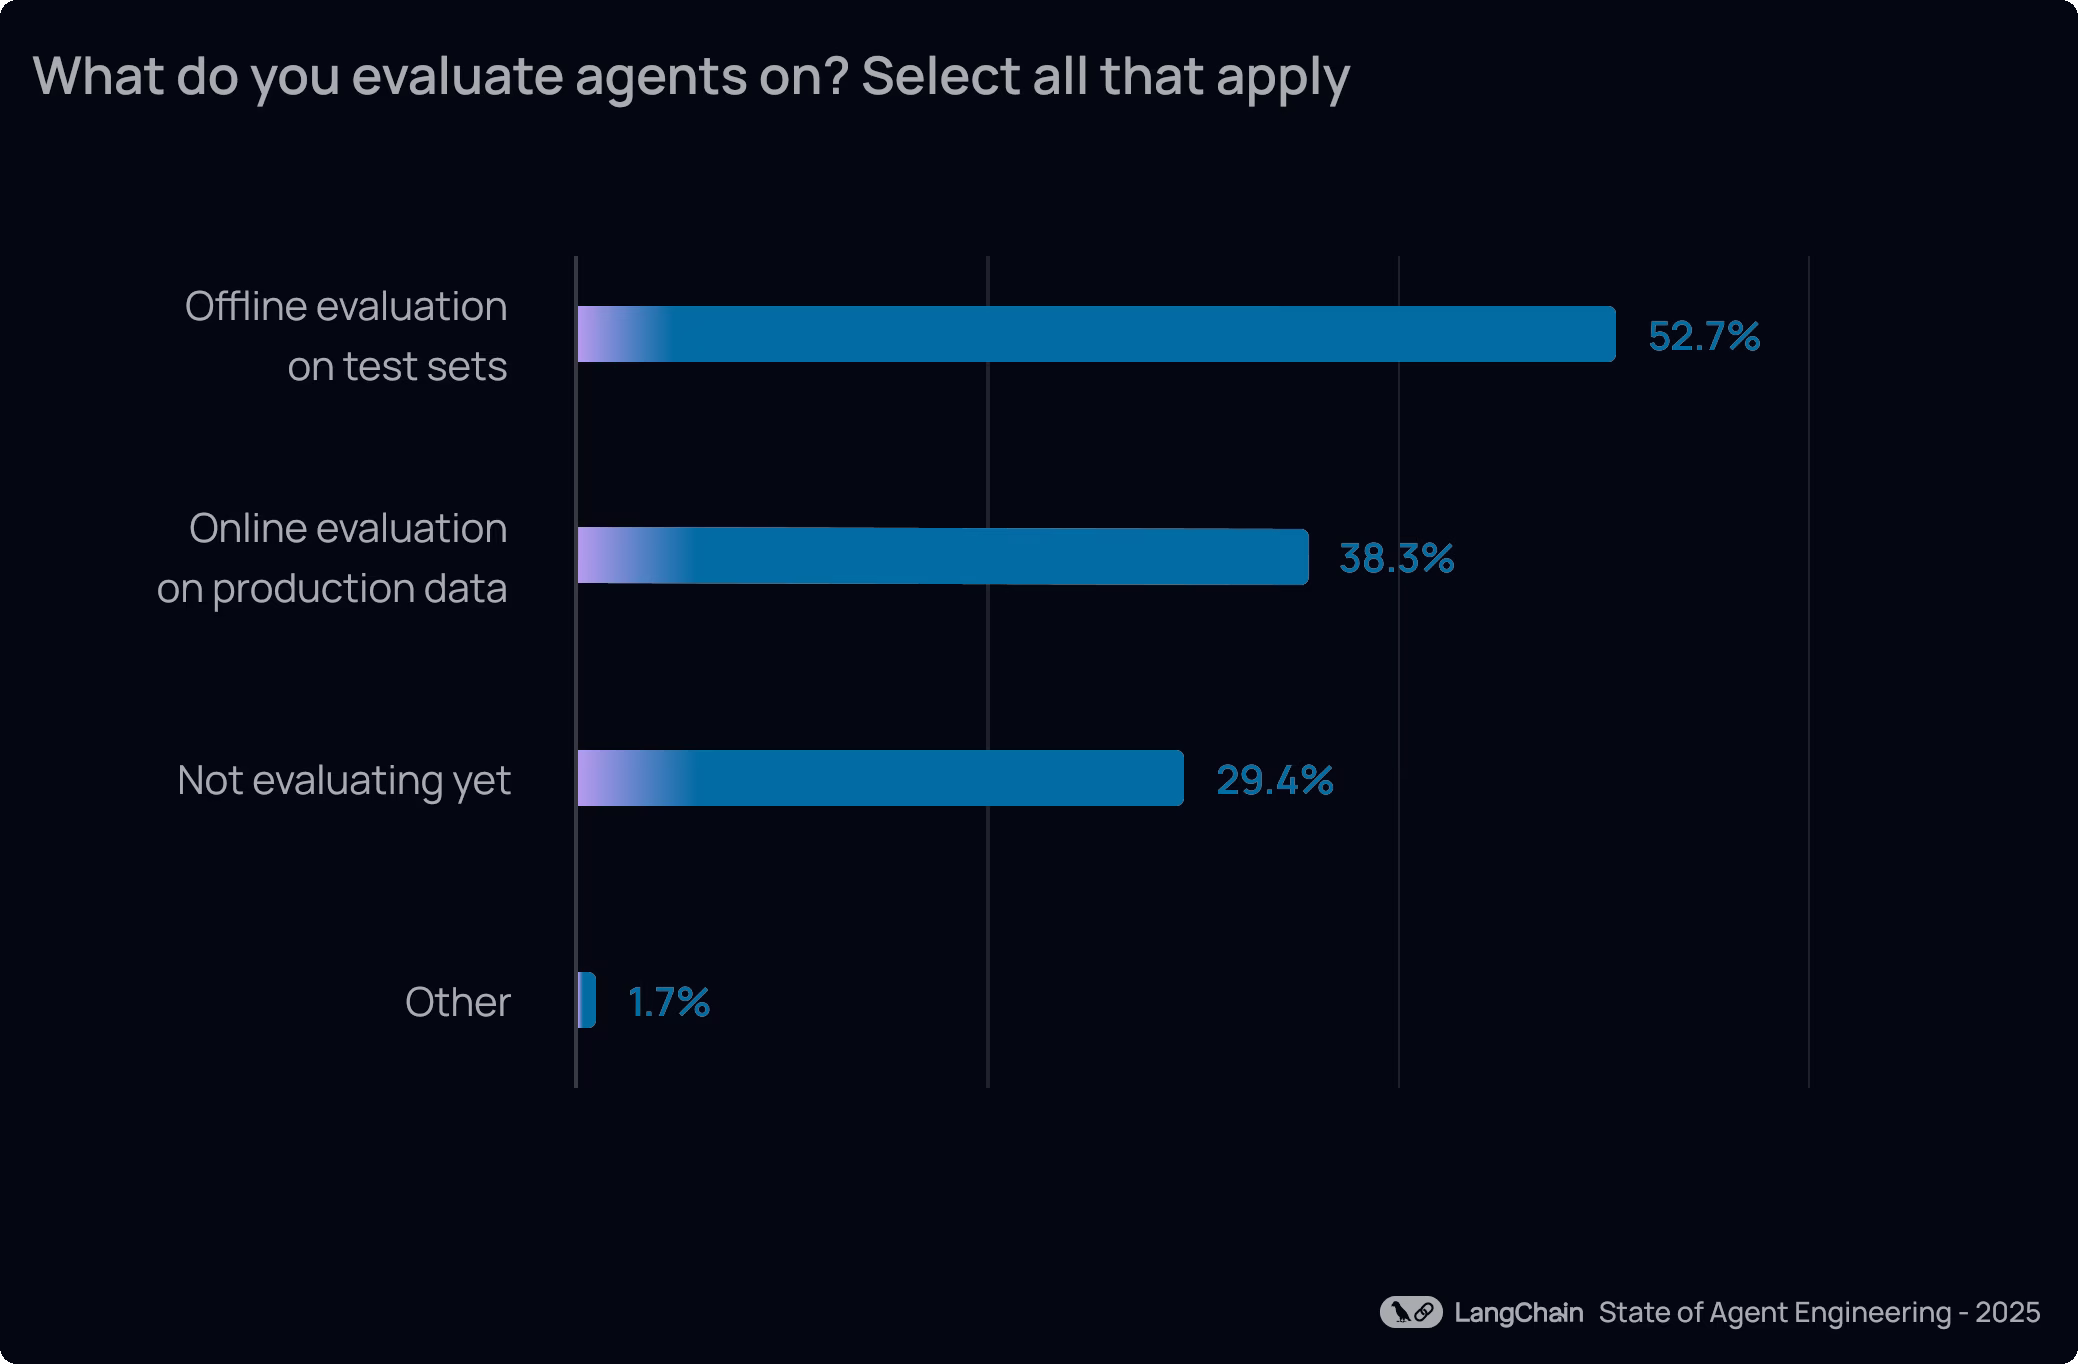
While observability is more widely adopted, agent evals are still catching up and gaining more awareness. Just over half of organization (52.4%) report running offline evaluations on test sets, indicating that many teams see the importance of catching regressions and validating agent behavior before deployment. Adoption of online evals is lower (37.3%) but growing as teams start to monitor real-world agent performance.
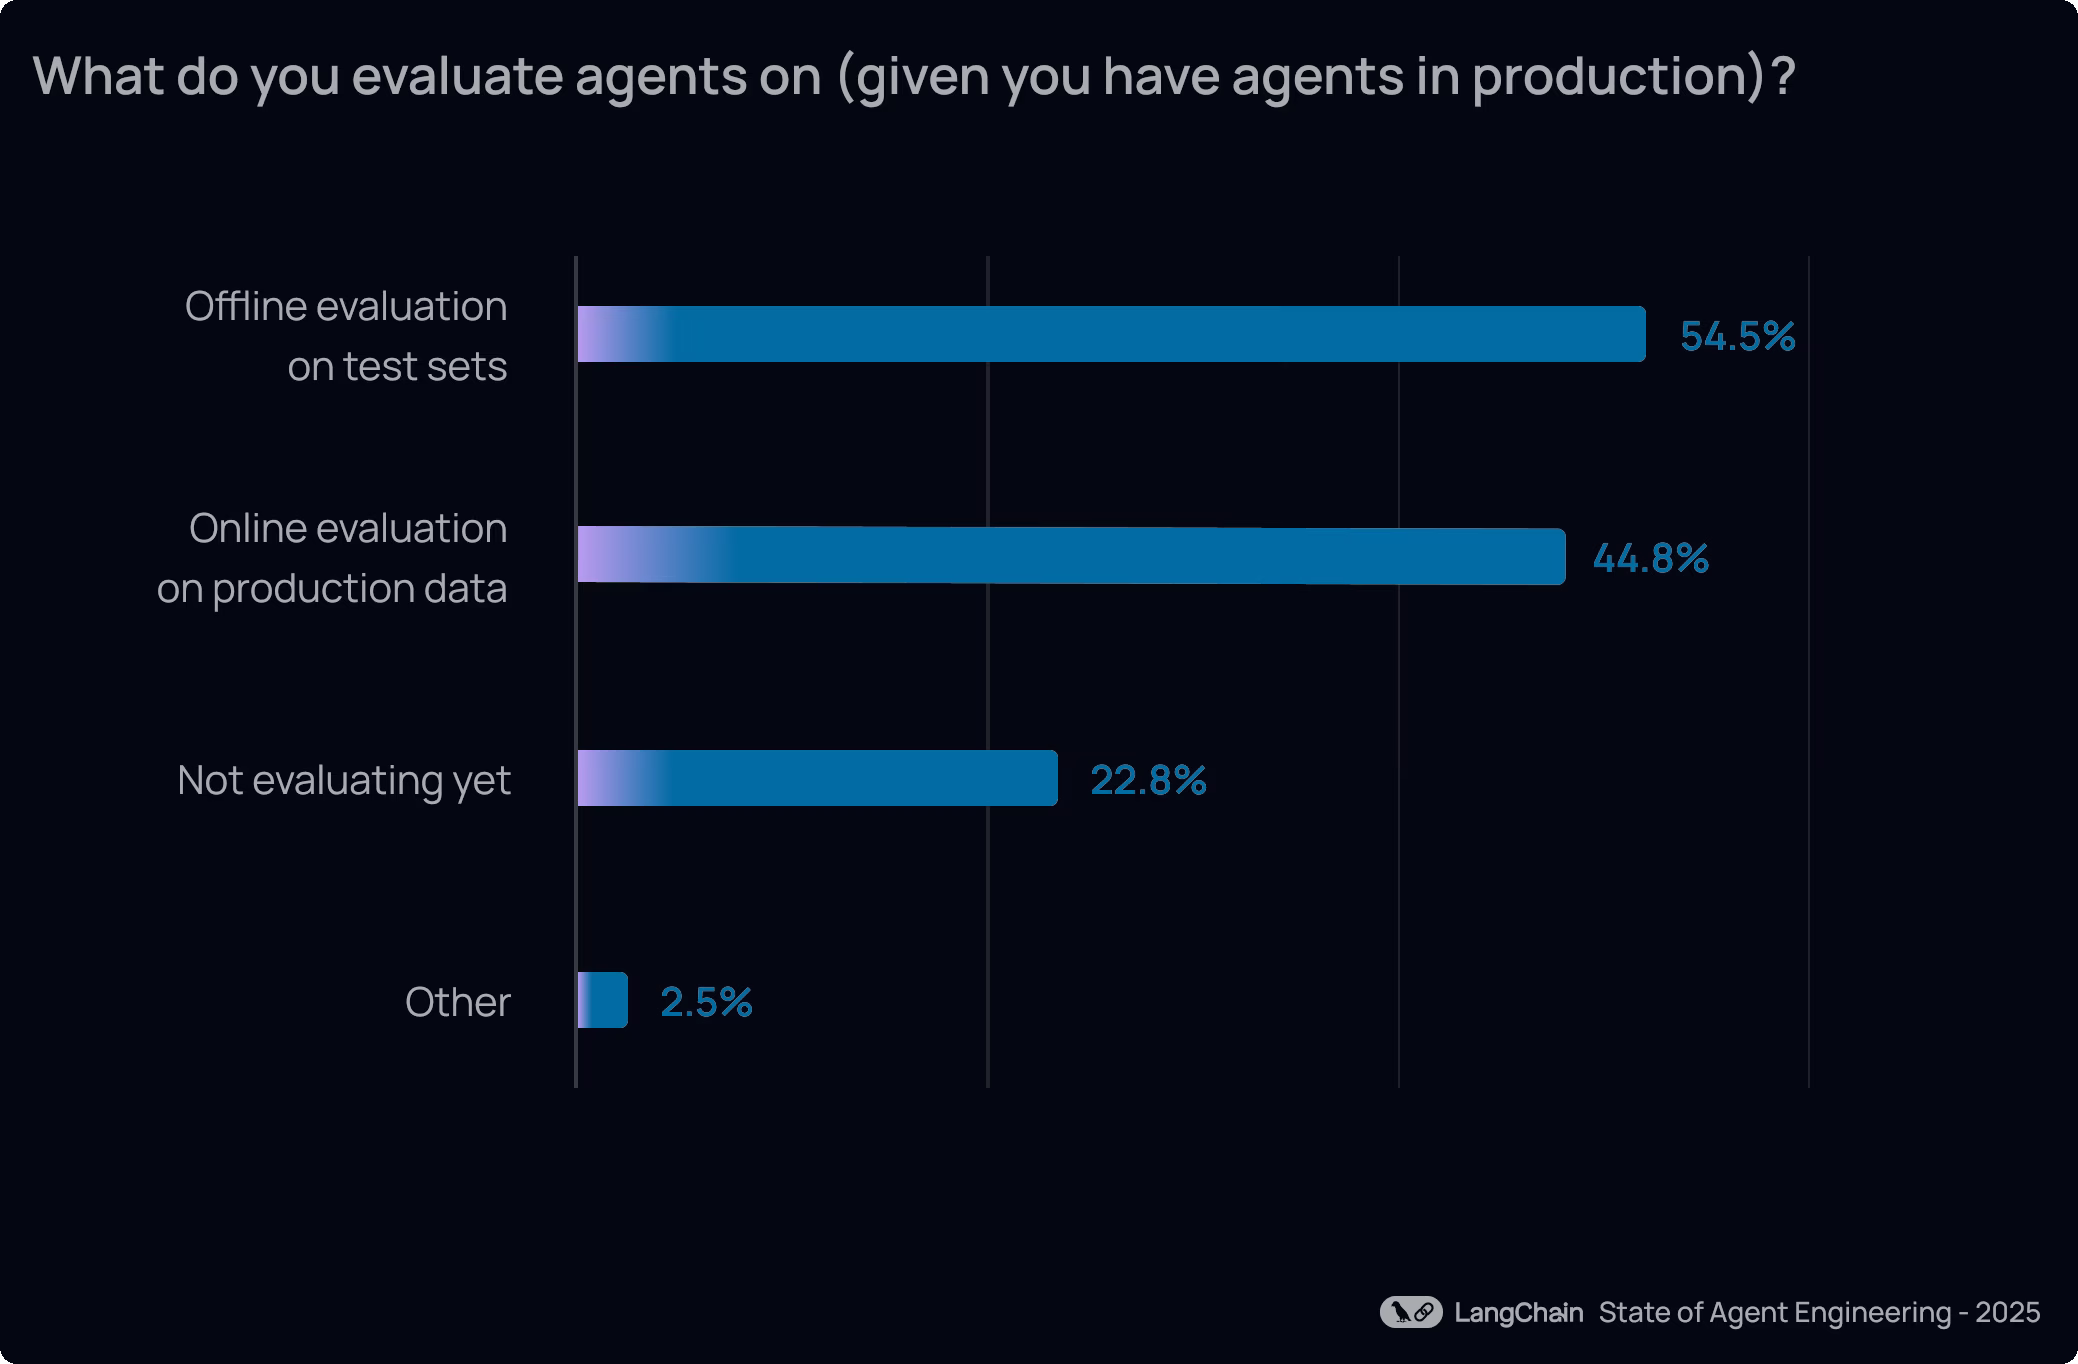
Evaluation practices likely mature more for those who already have agents in production, as overall evals adoption is meaningfully higher (”not evaluating” drops from 29.5% to 22.8%). We also see a more organizations running online evals (44.8%), suggesting that once agents face real users, teams need to observe production data to detect issues in real time.
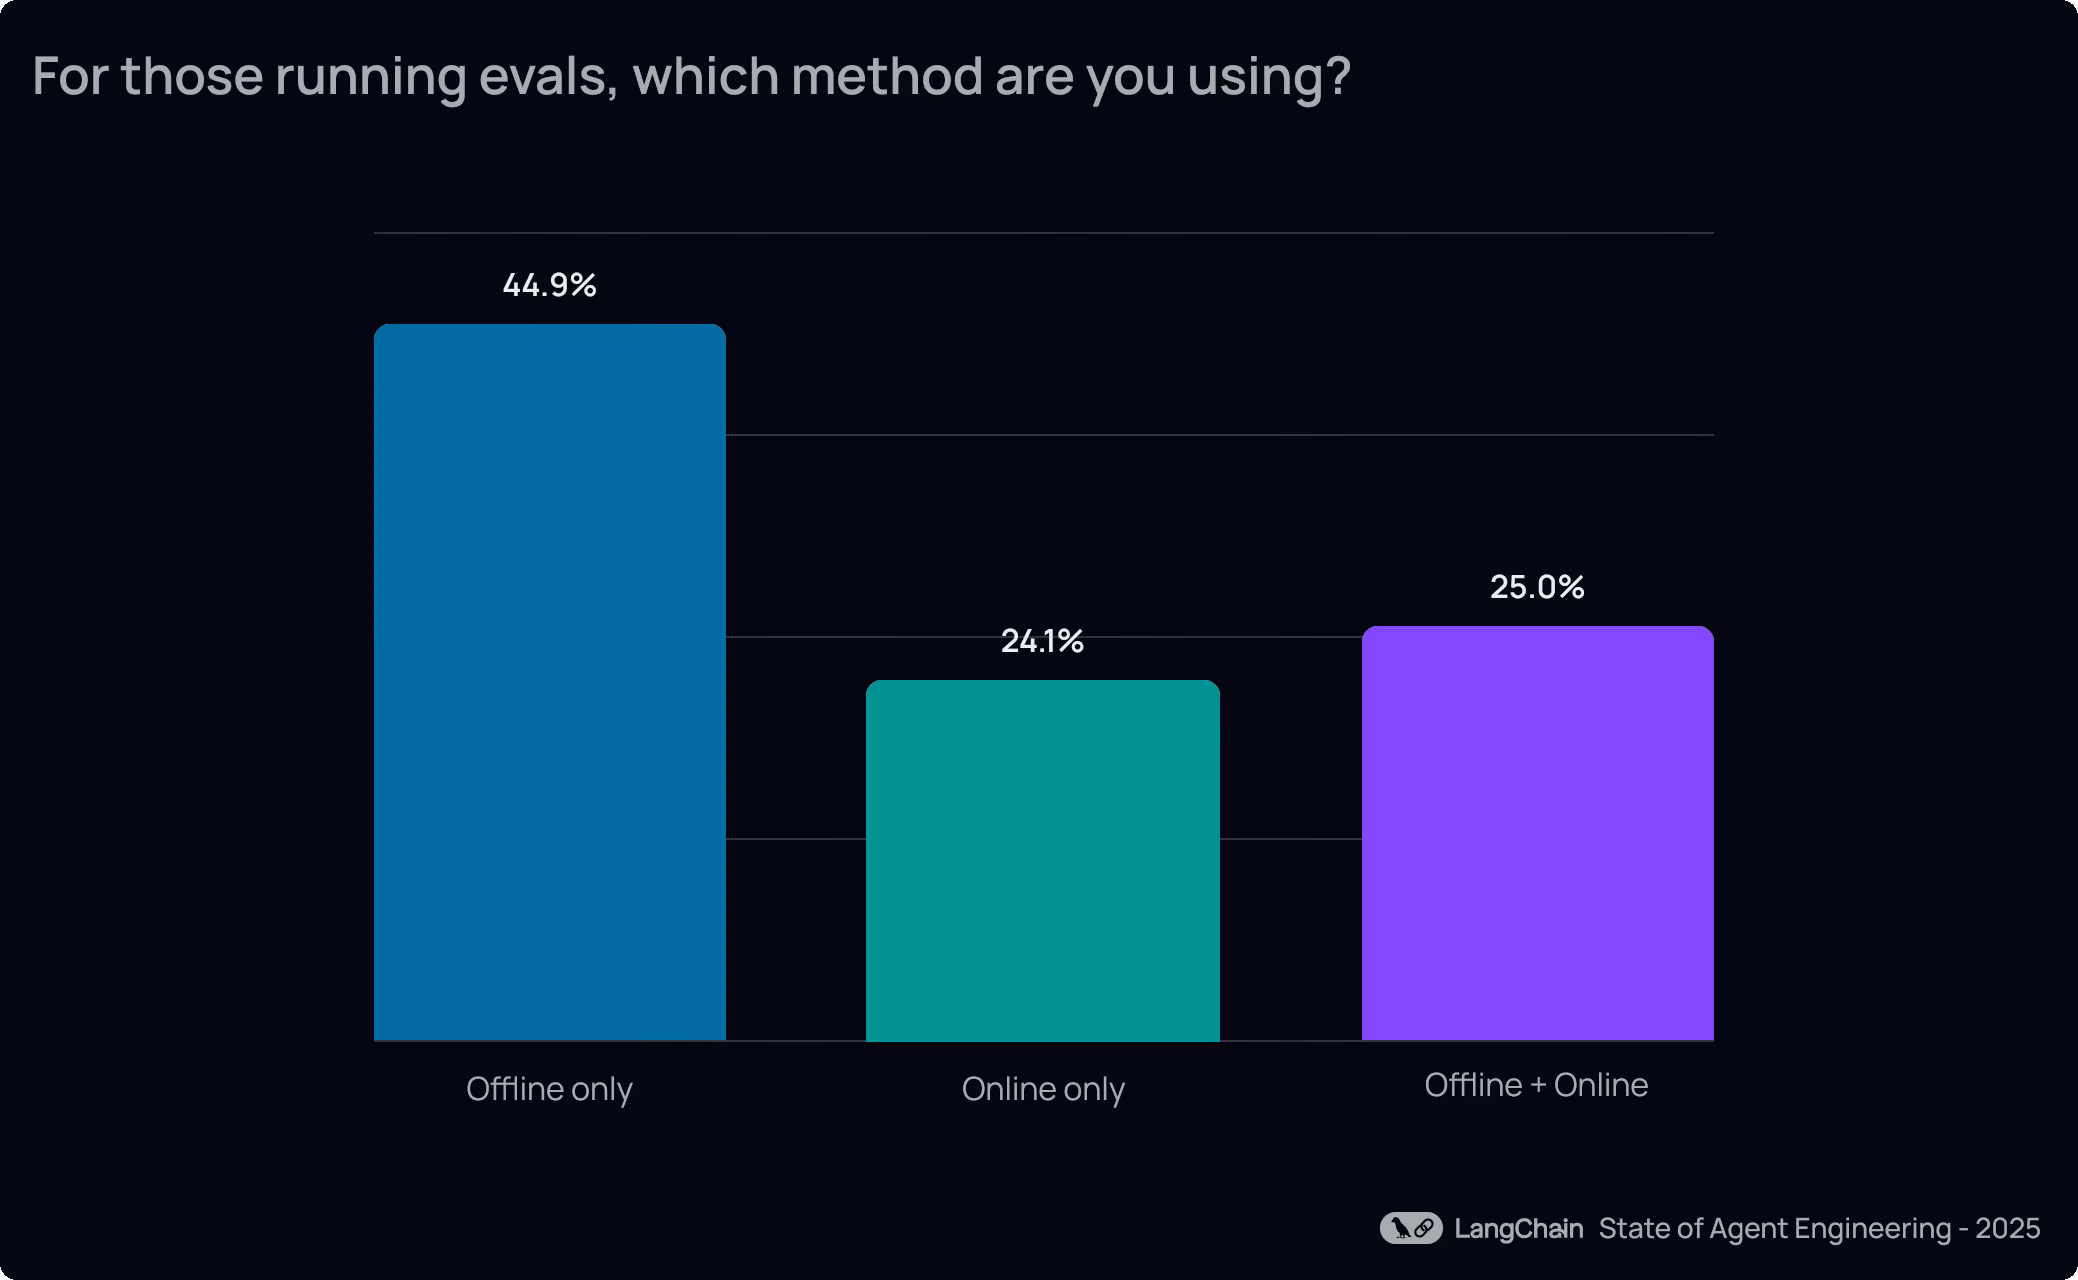
Most teams still start with offline evals, likely due to their lower barrier to entry and clearer setup, but many are layering approaches. Of the organizations running any evals, nearly a quarter combine both offline and online evaluations.
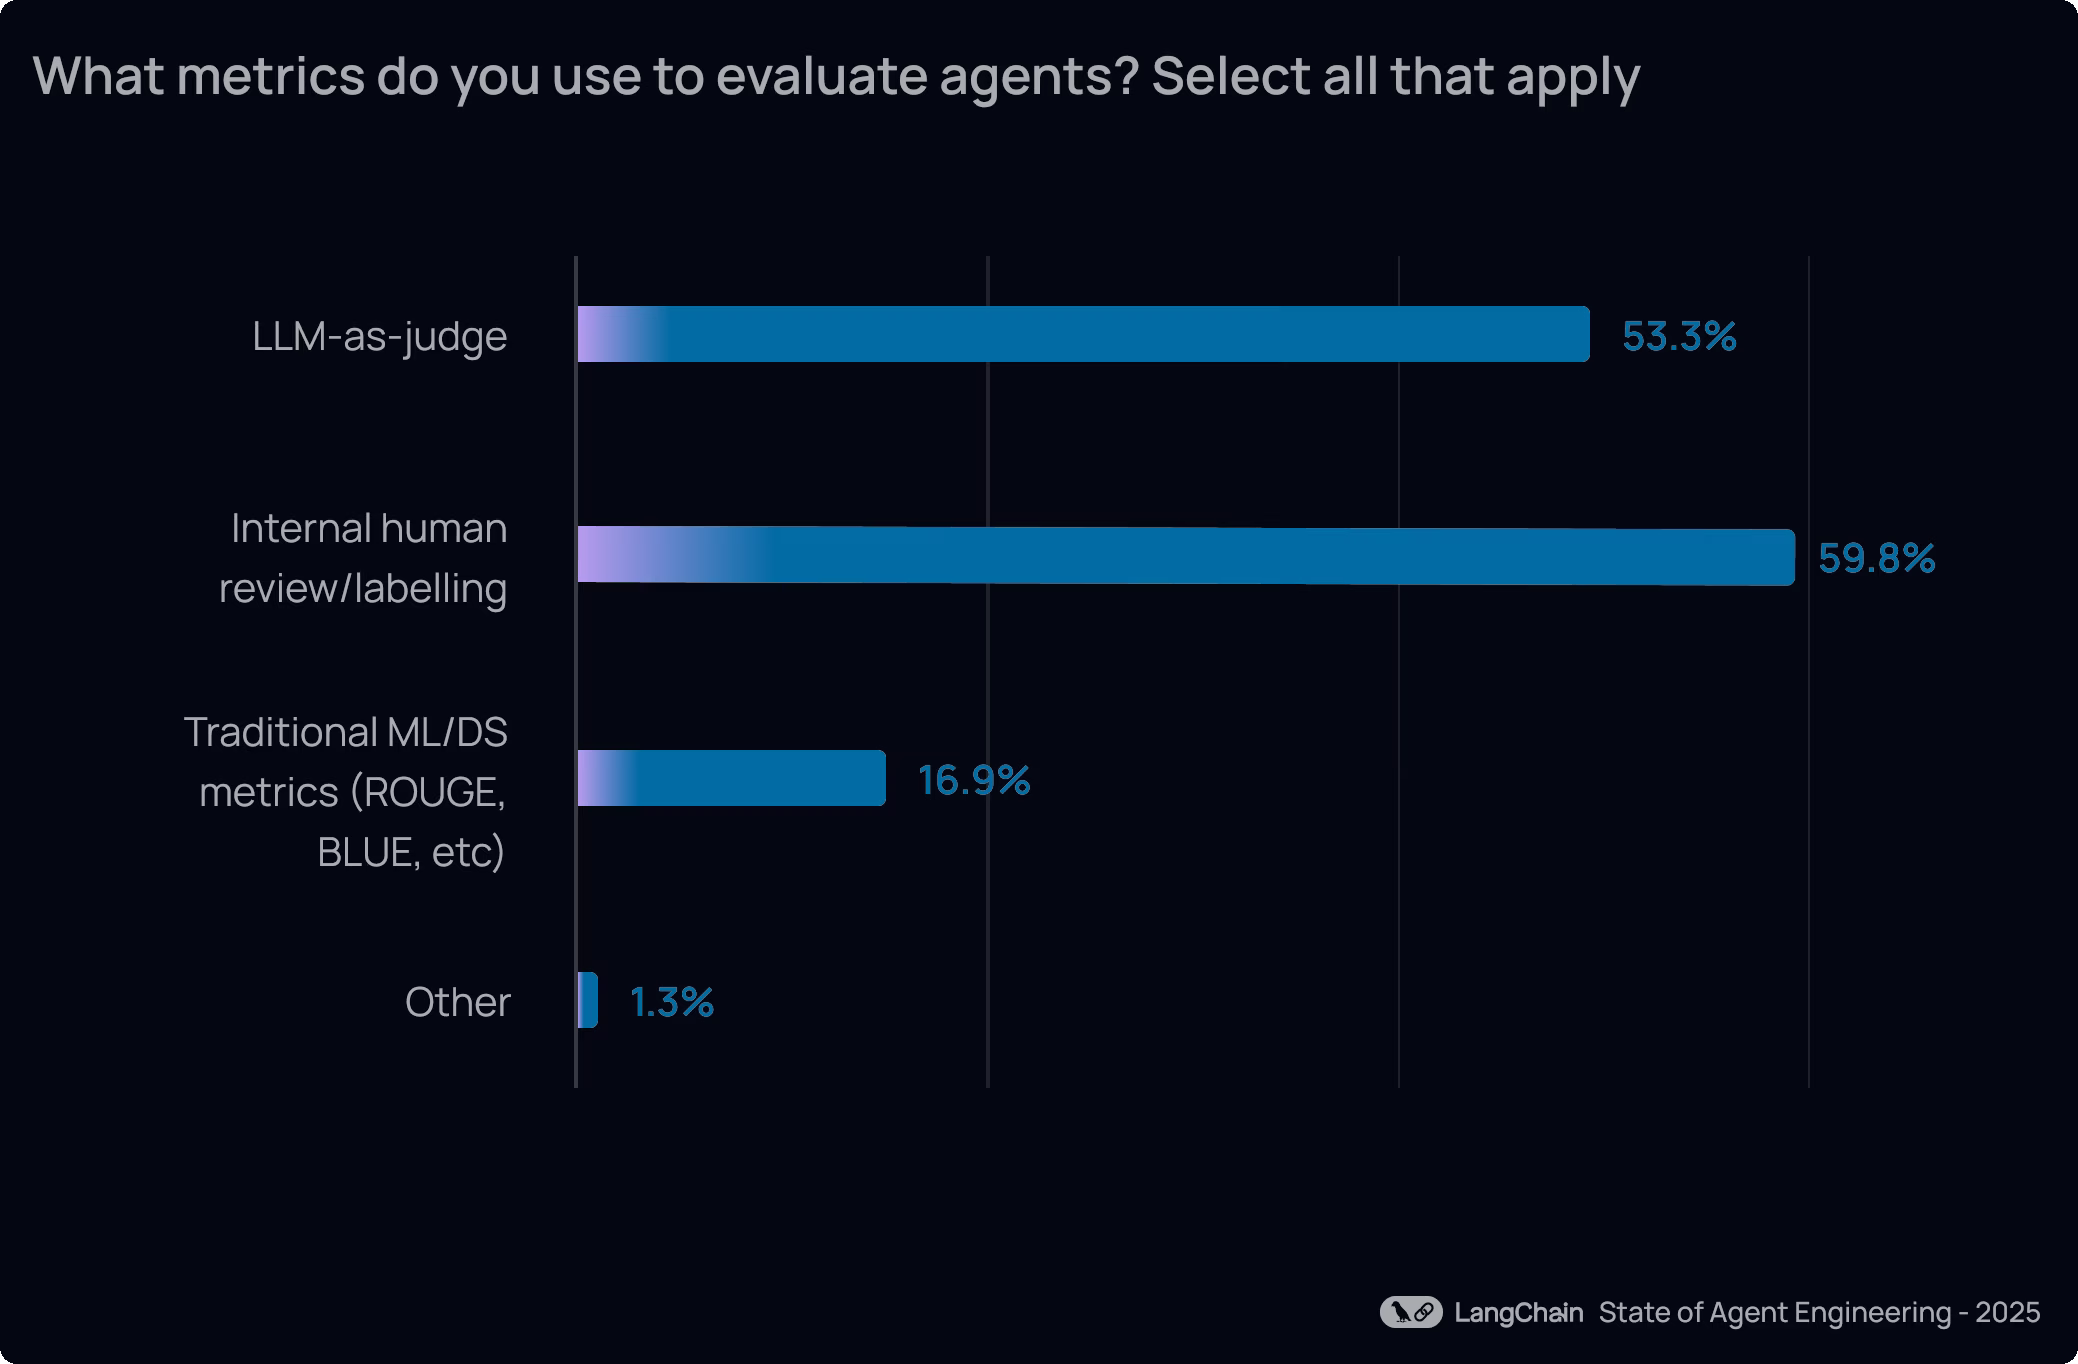
These organizations running evals also rely on a mix of human and automated approaches for evaluation, implementing LLM-as-judge for breadth and human review for depth. More broadly, human review (59.8%) remains essential for nuanced or high stake situations, while LLM-as-judge approaches (53.3%) are increasingly used to scale assessments of quality, factual accuracy, and guideline adherence. In contrast, traditional ML metrics like ROUGE and BLEU see limited adoption. These may be less suitable for open-ended agent interactions where multiple valid responses exist.
Model and tool landscape
OpenAI models dominate adoption, but few teams are betting on a single provider.
More than two-thirds of organizations report using OpenAI’s GPT models, yet model diversity is the norm — with over three-quarters using multiple models in production or development. Teams increasingly route tasks to different models based on factors like complexity, cost, and latency rather than going for platform lock-in.
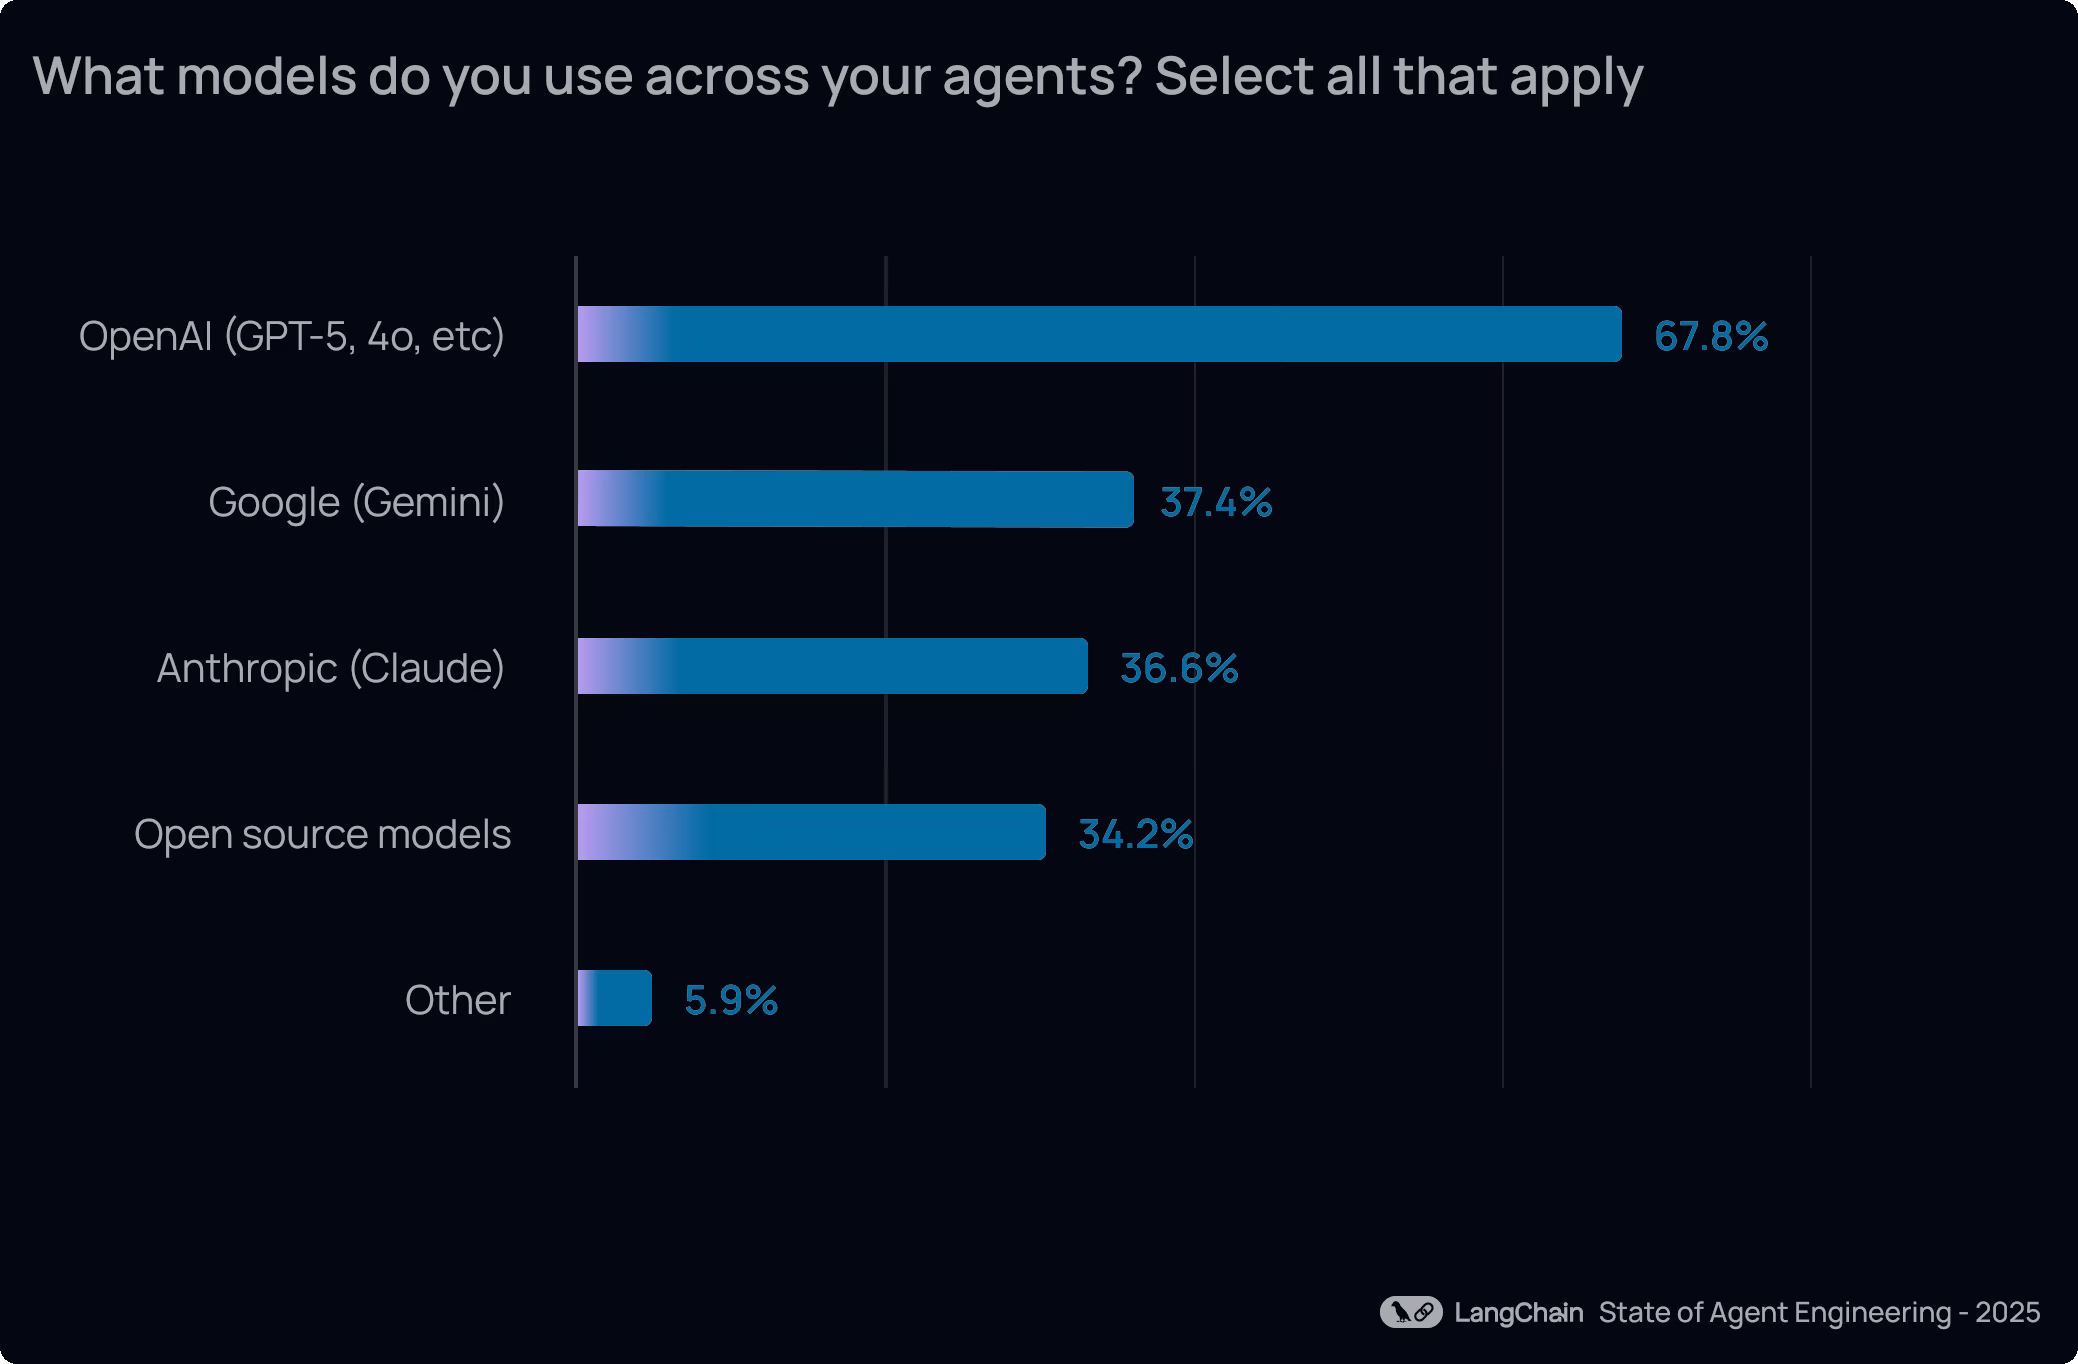
Despite the convenience of commercial APIs, running models in-house remains an importance strategy for many organizations. A a third of orgs report investing in the infrastructure and expertise required to deploy their own models. This open source model adoption may be driven by high-volume cost optimization, data residency and sovereignty requirements, or regulatory constraints in sensitive industries.
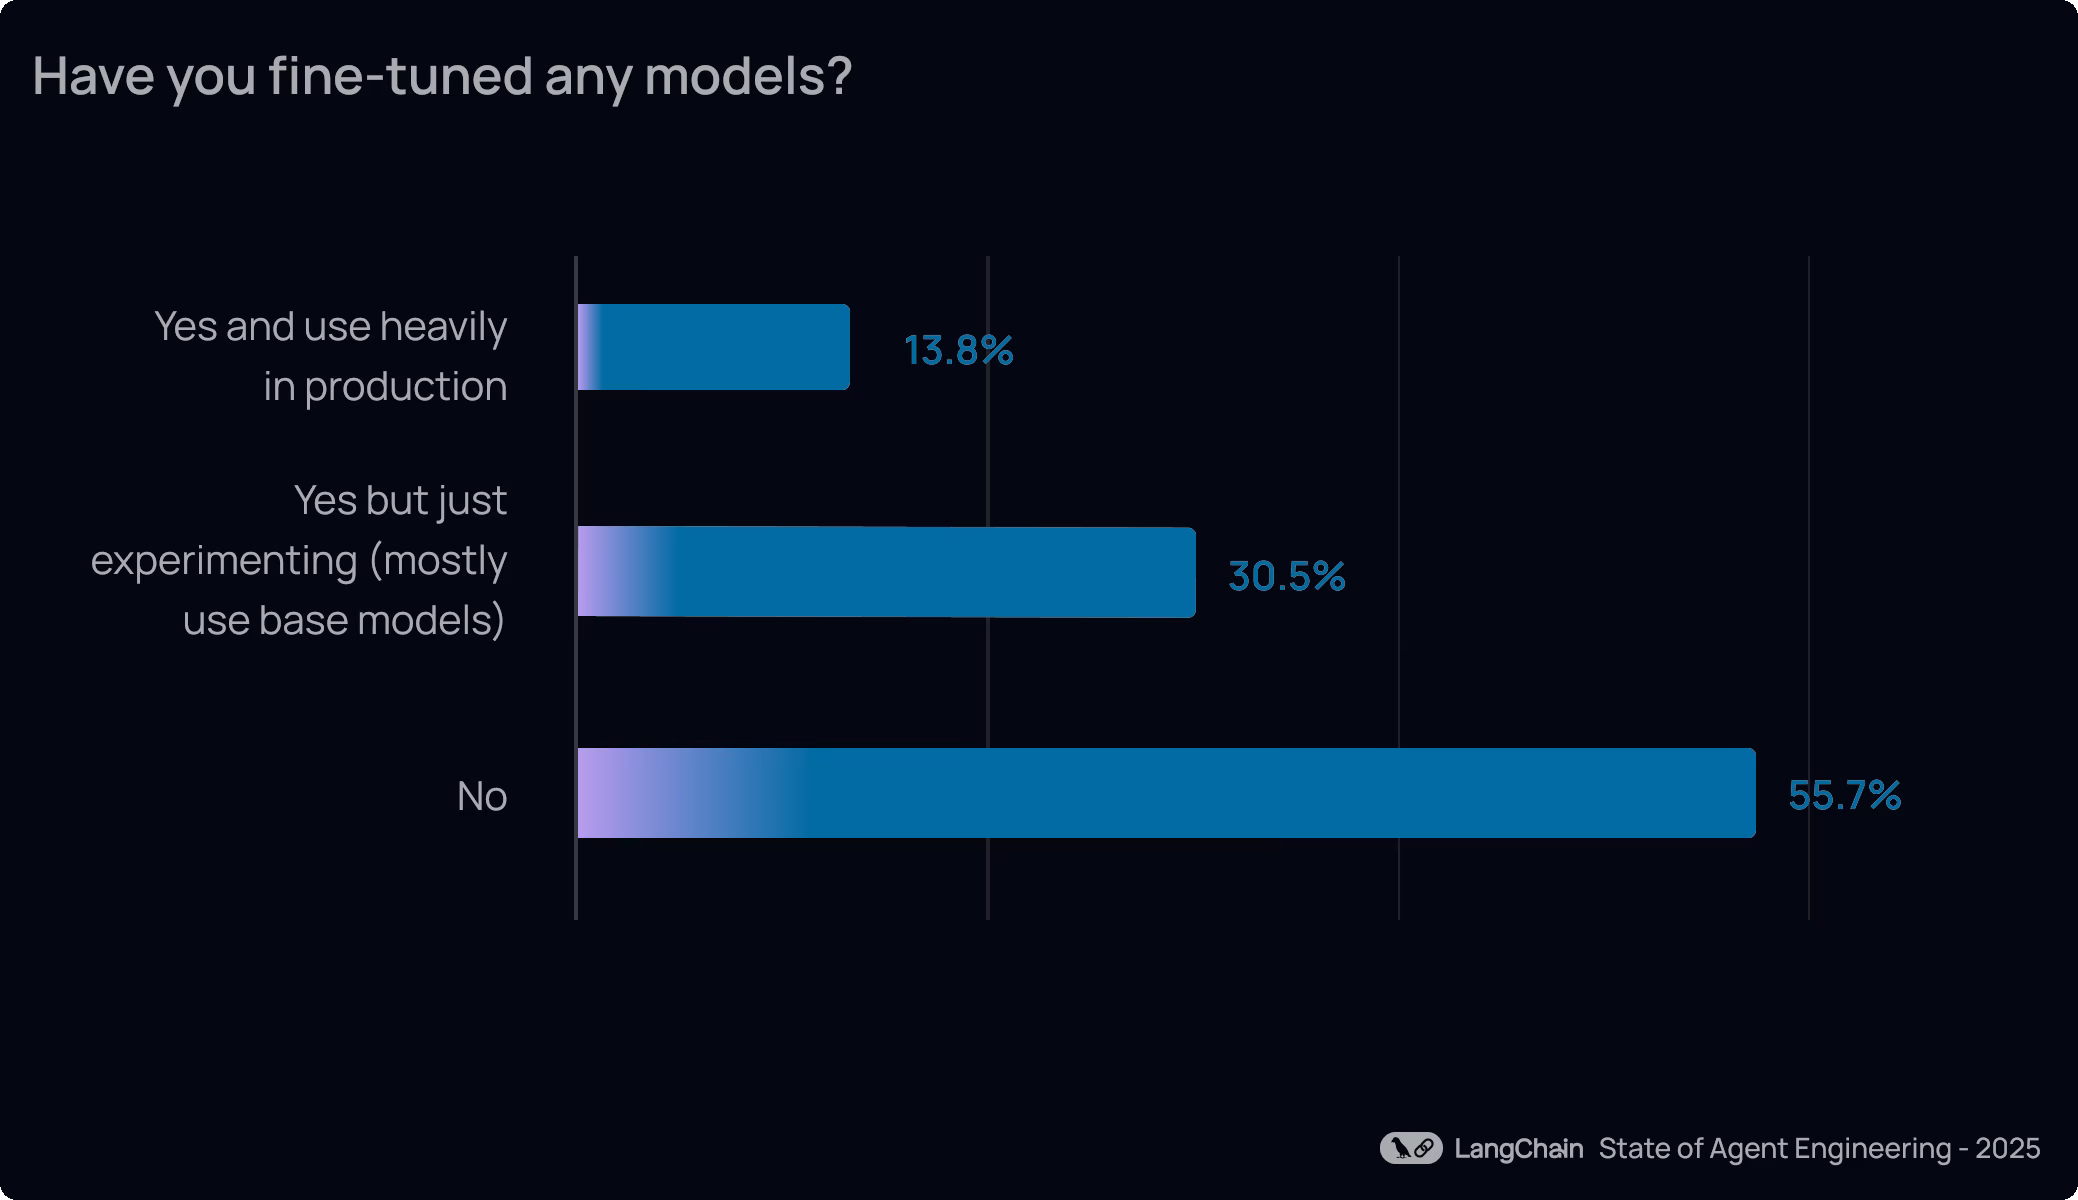
At the same time, fine-tuning remains specialized, not standardized. A majority of organizations (57%) are not fine-tuning models, instead relying on base models combined with prompt engineering and RAG. Since fine-tuning requires significant investment in data collection, labeling, training infrastructure, and ongoing maintenance, it seems to be reserved for mostly high-impact or specialized use cases.
What agents are being used daily?
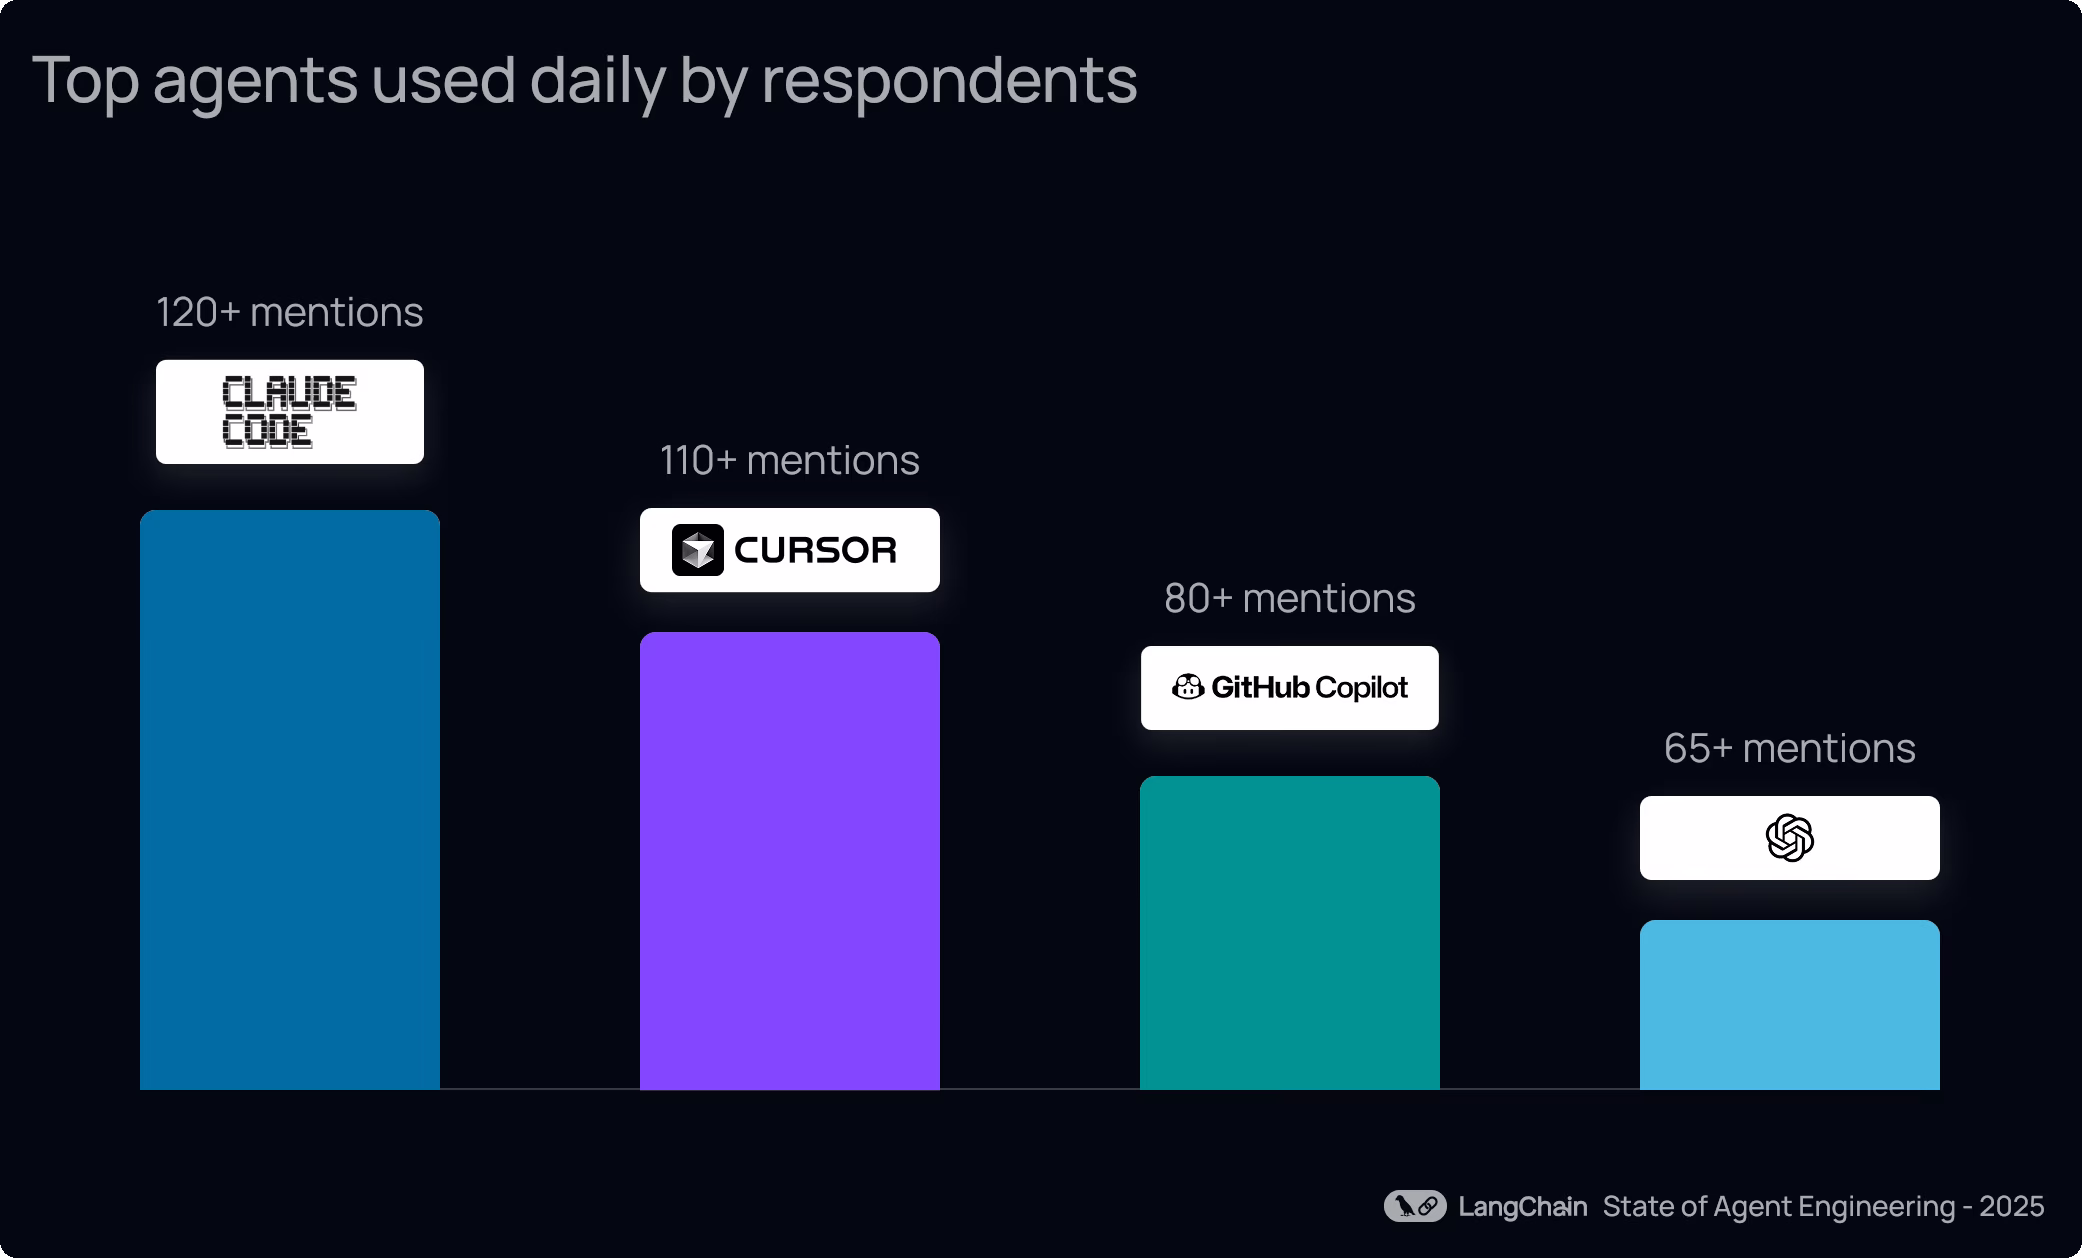
When we asked, “What agents do you use the most in your day-to-day?” a few clear patterns emerged from the write-in responses.
1. Coding agents dominate daily workflows.
By far the most commonly mentioned agents were coding assistants. Respondents repeatedly cited tools like Claude Code, Cursor, GitHub Copilot, Amazon Q, Windsurf, and Antigravity as part of their everyday development loop, whether it was for code generation, debugging, test creation, or navigating large codebases.
2. Research & deep research agents are the next most used.
The second most common pattern was research and deep research agents powered by ChatGPT, Claude, Gemini, Perplexity, and similar tools. These agents are used to explore new domains, summarize long documents, and synthesize information across sources. They’re often used as a companion to coding agents in the same workflow.
3. Custom agents built on LangChain and LangGraph are also popular.
A third, distinct cluster of answers pointed to custom agents, with many respondents building on LangChain and LangGraph. Respondents described internal agents for things like QA testing, internal knowledge-base search, SQL/text-to-SQL, demand planning, customer support, and workflow automation.
A meaningful minority also noted that they don’t yet use agents beyond LLM chat or coding assistance, underscoring that while agent usage is widespread, broader “agentic everything” is still in its early innings.
Methodology
The insights from this report were aggregated from a public survey that we ran for 2 weeks from Nov 18th-Dec 2nd, 2025. We received 1340 responses. Here’s some demographic data:
Top 5 industries:
- Technology (63% of respondents)
- Financial Services (10% of respondents)
- Healthcare (6% of respondents)
- Education (4% of respondents)
- Consumer goods (3% of respondents)
- Manufacturing (3% of respondents)
Company size:
- <100 people (49% of respondents)
- 100-500 people (18% of respondents)
- 500-2000 people (15% of respondents)
- 2000-10,000 people (9% of respondents)
- 10,000+ people (9% of respondents)
Check out relevant resources


Get started with agent observability & evals
LangSmith helps teams observe, evaluate, and deploy agents.