

.png)

Key Takeaways
This macroeconomic research agent analyzes GDP data across all 27 EU member states, detects anomalies, investigates structural and cyclical drivers at the sector level, and produces a 13-section cited briefing in approximately 45 minutes. Deep Agents orchestrates each research layer, LangSmith captures every step, and every finding traces back to the primary source that produced it.
The You.com Finance Research API scores 87.29% on FinSearchComp (arXiv 2509.13160), a public financial services benchmark, with a full 27-country GDP run costing roughly $2.20 in API calls. It combines licensed structured data from providers including S&P Global with live web intelligence across central bank commentary, regulatory signals, and sector-level analysis.
Macro research desks need to know, on a regular basis, which countries in a given set are performing anomalously and why. The underlying data exists but it is fragmented. A single GDP figure might require reconciling a Eurostat release against a national statistics office publication that arrived on a different schedule and uses a different methodology. Getting from raw data to a usable, sourced briefing can be as time consuming as the analysis itself. To show this in practice, we built an agent and ran it against 2025 GDP data for all 27 EU member states.
Ireland came back as the single largest outlier, with 12.3% GDP growth that looked like a boom. Per-country investigation identified it as a pharma-led export surge front-loaded ahead of US tariffs, with the industrial sector alone contributing +6.55pp to the print. Modified GNI showed a far more modest number. Germany was flagged for the opposite reason: structural contraction driven by automotive exposure and construction collapse, not a cyclical dip. The agent produced that distinction, sourced and cited, in 45 minutes costing $2.20 in API calls.
The findings are only half the story. In financial services, the ability to explain how a conclusion was reached matters as much as the conclusion itself. AI agents create a gap here: without explicit instrumentation, the decisions an agent makes during a run are lost once the run completes. This architecture preserves the decision log: every query issued, every response received, and every intermediate result produced before the final report is written. LangSmith captures the complete execution trace as the agent runs, so anyone reviewing the output can follow any data point in the final report back to the source that produced it.
The prompt
Using the latest available GDP data for 2025, analyze each country within the EU economic zone. Highlight those that are increasing or decreasing at an anomalous rate. Specify and break down which industries are causing these shifts and investigate macroeconomic trends within each country that are contributing.What the output looks like
The query has two primary questions: which EU-27 countries are growing or contracting anomalously, and what structural and cyclical forces are driving those deviations?
You get a structured briefing: GDP trajectory, anomaly drivers, and second-order implications including rates sensitivity, FX exposure, sovereign risk signals, and sector positioning. Every step is visible and auditable.
The report follows a standard format:
- Executive Summary: Headline numbers, key patterns, most important finding
- Methodology & Data Notes: Sources used, data vintage, known caveats
- Regional Overview: Aggregate GDP, average growth rate, macro context
- Country-by-Country GDP Table: All countries ranked by growth rate, anomaly flags, delta from mean
- Multi-Year Growth Context: 3–5 year growth trajectory
- Anomaly Analysis, High Growth: Per-country deep dives
- Anomaly Analysis, Low Growth / Contraction: Per-country deep dives
- GDP Decomposition: Expenditure-side and sector-side breakdown tables
- Structural vs Cyclical Analysis: Classification of each anomaly
- Macroeconomic Themes & Root Causes: Cross-cutting forces
- Policy Context: Monetary, fiscal, EU-level
- Risks & Forward-Looking Assessment: Implications for the next 1-2 years
- Sources: Unified sequential [[n]] numbering from all workpapers
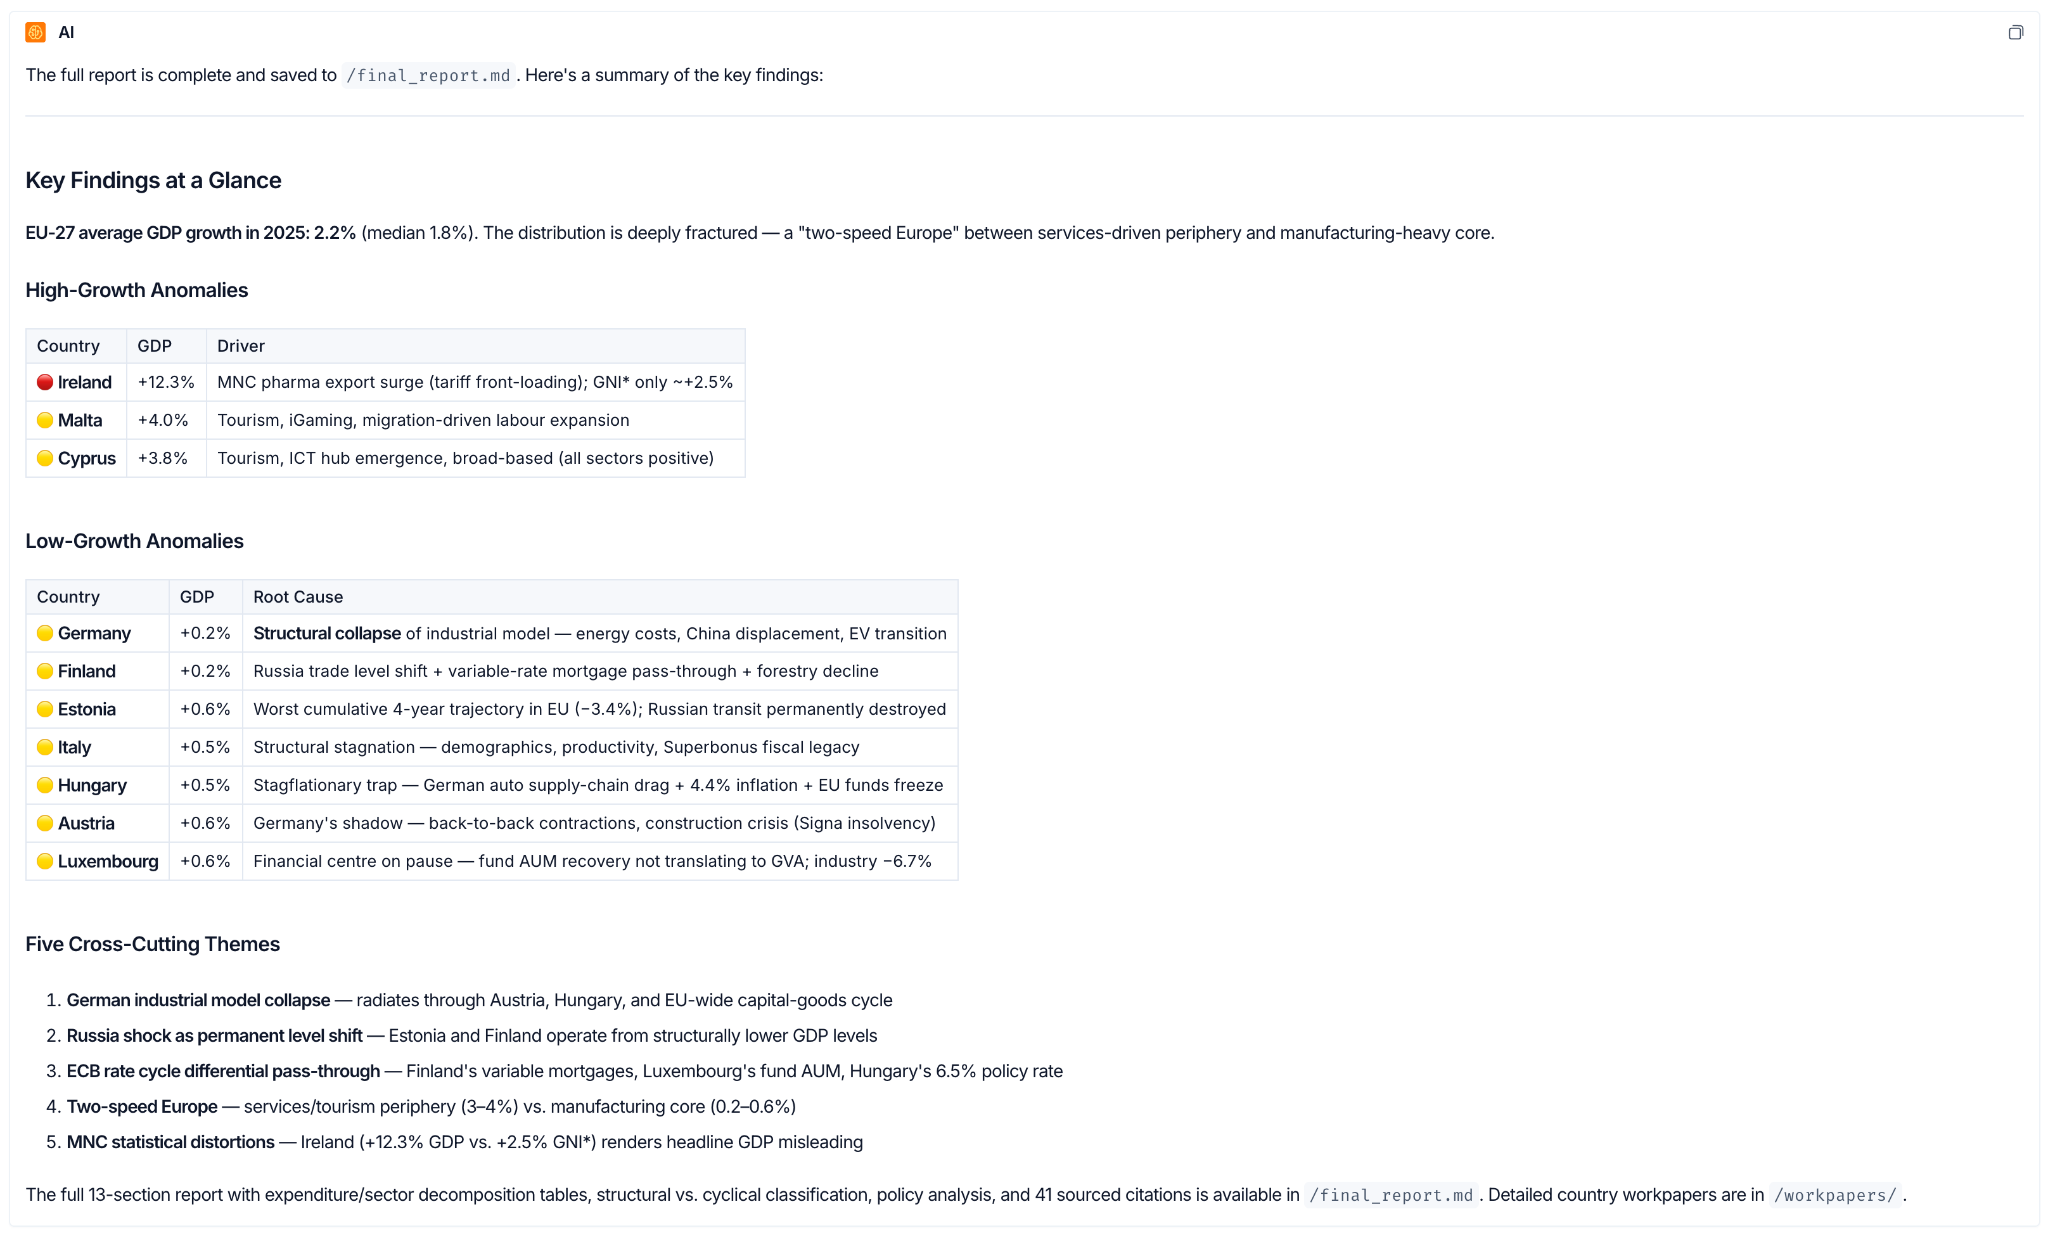
Key findings:
- Ireland's 12.3% is driven by multinational pharma output and IP effects, not domestic activity. Modified GNI would show a far more modest number.
- Major laggards share a common thread: exposure to US tariffs, Chinese competition in manufacturing, and high-rate-lag drag on construction.
- Spain, Poland, Bulgaria, and Croatia outperformed on real wage recovery and EU fund disbursements.
See the full report, subagent workpapers, country-by-country breakdown, industry attribution, macroeconomic root causes, and all cited sources. View in the GitHub repository
What Deep Agents and LangSmith make possible here
The Finance Research API handles data retrieval, reasoning, and synthesis. Give it a complex research query and it returns an answer grounded in public and private data, with inline citations. Deep Agents and LangSmith provide the engineering tools and infrastructure to build around it: context engineering, subagent management, tool execution, observability, and production deployment.
Context engineering. System prompts, subagents, Skills and file system management (via Backends) ensure that each subagent strictly receives only the context it needs. This allows for designing repeatable and reliable subagent behaviors.
Subagent management. Five predefined subagents and one general-purpose subagent built into Deep Agents by default. Some run once; others fan out in multiples. The country-investigator runs one instance per anomalous country. Define it once; Deep Agents handles delegation, concurrency, failure isolation, and result aggregation.
Tool execution. The Finance Research API is one tool call. MCP servers, REST endpoints, and internal data feeds plug in the same way, scoped per subagent. In a few lines of code, you can add new tools or data sources to a particular subagent.
Production deployment. LangSmith Deployment handles scaling, persistent storage via StoreBackend, and environment management. The same agent runs in local dev and in production without changes.
Observability. Every you_finance_research call, built-in tool call (todo list, file reads, workpaper write) and orchestrator decision is captured in LangSmith. The trace is the audit trail. It is easily accessible via CLI, MCP, as JSON export and the LangSmith UI.
Implementation
.png)
Defining the Finance Research API tool
Each subagent gets one tool: the Finance Research API. This API is itself an agent: it runs multi-step research, ingests structured public data (World Bank, IMF, OECD, Eurostat, FRED) and licensed private data, verifies sources across parallel branches, and returns cited answers with [[n]] source tags. Wrapping it as a LangChain tool makes it callable by Deep Agents.
@tool(parse_docstring=True)
async def you_finance_research(
    input: str,
    research_effort: Literal["deep", "exhaustive"] = "deep",
) -> str:
    """Research financial and macroeconomic topics with cited sources.

    Args:
        input: The research question (max 40,000 characters).
        research_effort: How thorough the research should be.
    """
    body = {"input": input, "research_effort": research_effort}
    headers = {"Content-Type": "application/json", "X-API-Key": os.environ["YDC_API_KEY"]}

    async with httpx.AsyncClient(timeout=HTTP_API_TIMEOUT) as client:
        response = await client.post(HTTP_ENDPOINT, headers=headers, json=body)
        data = response.json()

    output = data.get("output", {})
    content = output.get("content", "")
    sources = output.get("sources", [])
    result = content

    if sources:
        result += "\n\n### Sources\n"
        for i, src in enumerate(sources, 1):
            title = src.get("title", "Untitled")
            url = src.get("url", "")
            result += f"[[{i}]] {title}: {url}\n"

    return result
The tool sends a research question with an effort level, pulls out the content field (with inline [[n]] citation tags) and the sources array, and appends them in a format the agent carries through to the final report. The read=None timeout is deliberate since the API can take several minutes on complex queries. The reference implementation also retries with exponential backoff on transient connection failures.
You can also load the tool via MCP instead of direct HTTP. You.com exposes a hosted MCP server at https://api.you.com/mcp?tools=you-finance that works with langchain-mcp-adapters.
Understanding the API's budget model
The Finance Research API has a finite compute and retrieval budget per call. It splits that budget across everything you ask in a single query:
- Focused queries (one entity, one analytical question) get the full budget and return rich, quantitative answers
- Overloaded queries (many entities, many analytical dimensions) split the budget and return thin, qualitative-only answers
- Data-retrieval queries (e.g., "GDP growth for all 27 EU countries") are cheap per entity once the API finds the right database endpoint, so batching many countries works well
This is why the agent issues focused queries rather than batching everything into a single call. Each focused call handles one analytical job and produces a discrete, attributable result, which matters as much for traceability (and hence compliance) as it does for result quality.
Query shapes that work
Three query shapes work reliably with this budget model. Each is encoded in its subagent's system prompt. The full prompts appear in the subagent definitions below.
Shape A — Data Tables: "[Metric] for all [N] countries in [year(s)]"
Structured data across many countries in a single call. Data retrieval is cheap per entity, so batching all 27 EU member states works fine:
"Provide real GDP growth rates (annual percent change, chain-linked volumes) for all 27 EU member states for each year from 2020 to 2025."

"Provide current account balances as a percentage of GDP for all 27 EU member states in 2025."
Shape A calls are also your primary source layer for compliance purposes. When the Finance Research API returns GDP figures from Eurostat or IMF databases, those source URLs are included in the response and carried forward into the workpaper. The claim chain that a MiFID II records review or an EU AI Act audit requires starts here.
Shape B — Per-Country Qualitative Context: "Here are the numbers from Eurostat. What explains them?"
The story behind the numbers. The agent feeds in the Eurostat data it already has from Shape A and asks for causal explanations from well-indexed sources:
"Ireland's Industry (B-E) GVA grew 29.1% in 2025 and GFCF contributed +6.32pp to GDP growth. What explains this? Was there front-loading of pharma exports ahead of US tariffs?"

"Germany's manufacturing GVA fell -0.8% and construction fell -2.9% in 2025. What specific factors explain this? Focus on: automotive production levels vs 2019, VW Group restructuring announcements."
Shape C — Mechanism Comparisons: "Compare [mechanism] across [2-3 closely related countries]"
How a shared mechanism played out differently across 2-3 related countries:
"How did ECB rate hikes in 2022-2023 affect Sweden and Denmark through their variable-rate mortgage markets? Compare with France's fixed-rate market."Each subagent's system prompt also specifies what to avoid: don't batch 4+ countries into a single analytical query, don't combine data retrieval with interpretation in one call, and don't escalate to exhaustive when deep fails. Narrow the scope or rephrase instead.
Defining the research subagents
Subagents don't inherit tools from the orchestrator. Each one is explicitly configured with an LLM of our choosing, a specific task, and exclusively the Finance Research API tool. By scoping the main task down to smaller units of work via subagents, we reduce context bloat, improve predictability and optimize overall cost and speed.
landscape_scanner_subagent = {
    "name": "landscape-scanner",
    "description": "Retrieve structured macroeconomic data tables for all EU member states via Shape A queries.",
    "system_prompt": """You are a macroeconomic data specialist...

    Run 2-4 Shape A queries at `deep` effort to build complete data tables.
    Write ALL results to /workpapers/landscape_scan.md as structured markdown
    tables with all citations preserved.""",
    "tools": [you_finance_research],
    "model": "fireworks:accounts/fireworks/models/minimax-m2p5", # subagents can use a different model than the orchestrator
}

anomaly_analyst_subagent = {
    "name": "anomaly-analyst",
    "description": "Analyze landscape data to compute regional mean, flag anomalous countries, and recommend investigation targets. Pure statistical analysis; no Finance Research API calls.",
    "system_prompt": """You are a quantitative analyst...

    Read /workpapers/landscape_scan.md. Compute the unweighted mean.
    Flag countries deviating by >=2.0 percentage points. Group by mechanism.
    Write your full analysis to /workpapers/anomaly_analysis.md, including
    a fenced JSON block at the end with investigation_targets.""",
    "tools": [],      # Only uses filesystem (provided by middleware)
    "model": "fireworks:accounts/fireworks/models/minimax-m2p5",
}
The remaining subagents (expenditure-decomposer, sector-decomposer, country-investigator) each follow the same structure: a focused system prompt, tools=[you_finance_research], and a dedicated workpaper path. The country-investigator is fanned out once per anomalous country identified by anomaly-analyst. See the full subagent definitions in prompts.py →.
Creating the orchestrator agent
With the subagents defined, the orchestrator is assembled with create_deep_agent(). The orchestrator's system prompt has the workflow coordination logic and analytical frameworks. Query construction knowledge lives in the subagent prompts.
from deepagents import create_deep_agent
from deepagents.backends import CompositeBackend, StateBackend
from deepagents.backends.filesystem import FilesystemBackend
from langgraph.checkpoint.memory import MemorySaver

backend = CompositeBackend(
    default=StateBackend(),
    routes={"/": FilesystemBackend(root_dir=reports_dir, virtual_mode=True)},
)

agent = create_deep_agent(
    model="fireworks:accounts/fireworks/models/minimax-m2p7", # swap any LangChain-compatible model string here
    tools=[],
    system_prompt=system_prompt,
    subagents=[
        landscape_scanner_subagent,
        anomaly_analyst_subagent,
        expenditure_decomposer_subagent,
        sector_decomposer_subagent,
        country_investigator_subagent,
    ],
    backend=backend,
    checkpointer=MemorySaver(),
)
Two things to note:
CompositeBackend routes agent-internal state to StateBackend (in-memory); file writes go to FilesystemBackend on disk. Subagents write workpapers and the final report there, keeping that content out of message history, which would get unwieldy. The orchestrator reads the workpapers back during synthesis; the final report lands at /final_report.md.
subagents gives the orchestrator a task tool. It dispatches subagents by calling task(subagent_type="landscape-scanner", description="..."). To run subagents in parallel, the orchestrator emits multiple task calls in a single message and Deep Agents runs them concurrently.
The multi-layer workflow
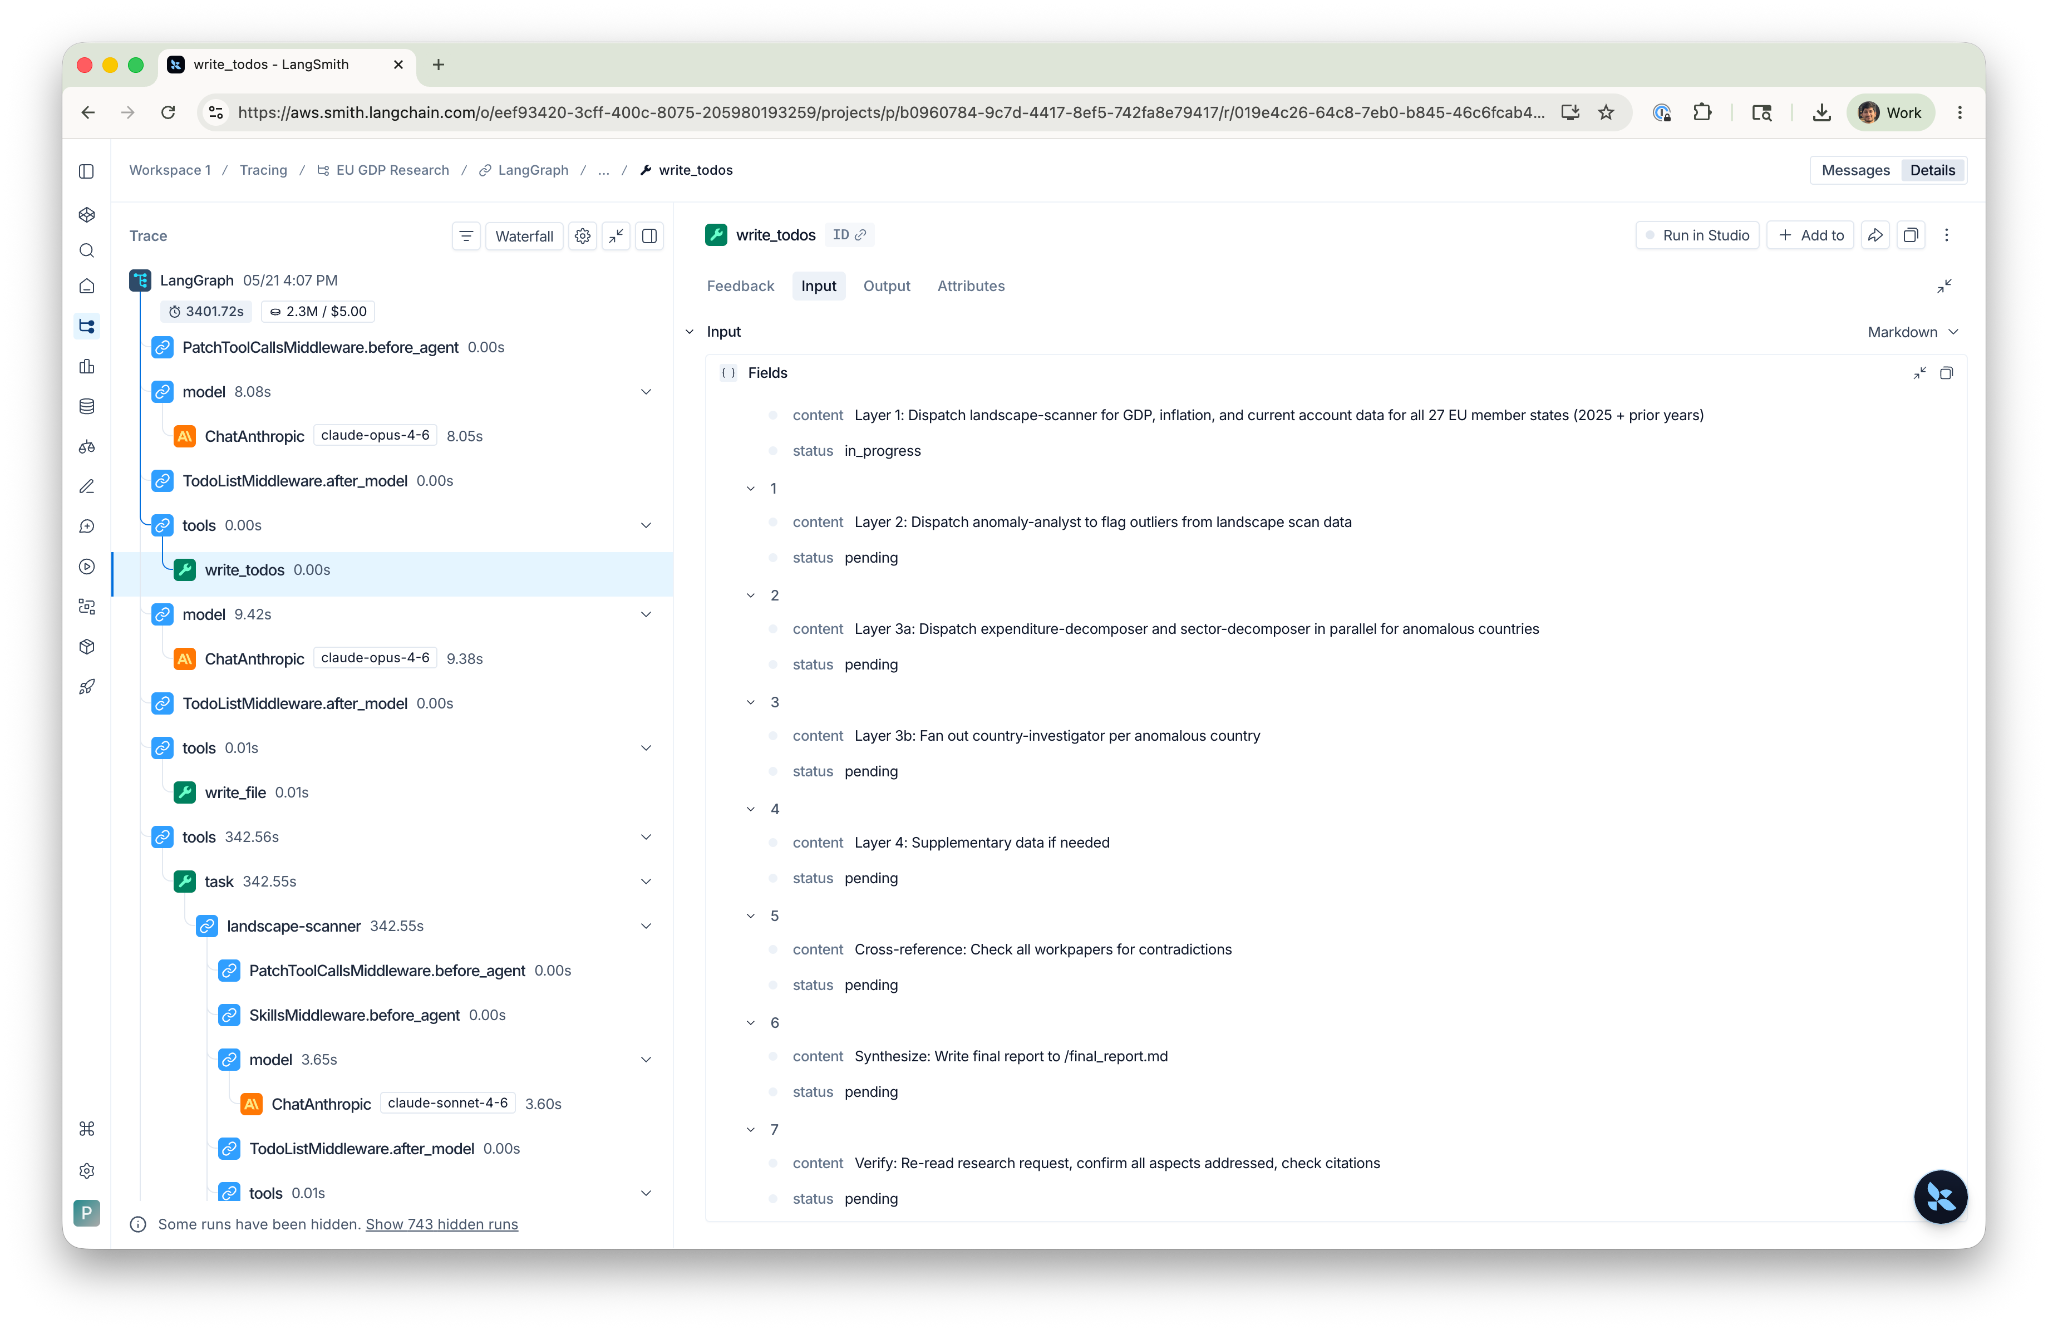
The orchestrator starts each run by calling write_todos to lay out a research plan as a checklist, an explicit artifact it tracks against throughout the run rather than relying solely on the system prompt.
1. [ ] Layer 1: Dispatch landscape-scanner for data tables
2. [ ] Layer 2: Dispatch anomaly-analyst to flag outliers
3. [ ] Layer 3a: Fan out expenditure-decomposer and sector-decomposer in parallel
4. [ ] Layer 3b: Fan out country-investigator per anomalous country
5. [ ] Cross-reference: Check workpapers for contradictions
6. [ ] Synthesize: Write final report
Each layer's results feed the next:
Layer 1: Landscape Scan. landscape-scanner fires 2-4 Shape A calls to the Finance Research API, building data tables for all 27 EU member states. Results go to /workpapers/landscape_scan.md.
Layer 2: Anomaly Detection. anomaly-analyst reads the landscape workpaper, computes the regional mean, flags countries deviating by 2+ percentage points, and writes a full analysis to /workpapers/anomaly_analysis.md with a fenced JSON block at the end. The step involves no Finance Research API calls; it is pure analysis and computation. The orchestrator reads the workpaper and parses investigation_targets from the JSON block to decide which countries get deep follow-ups.
Layer 3a: Quantitative Decomposition. expenditure-decomposer and sector-decomposer run in parallel: two task calls in a single message. Each fires one Shape A query and writes its workpaper. This gives the agent the numerical backbone for the whole analysis.
Layer 3b: Country Investigation Fan-Out. The orchestrator reads the decomposition workpapers, picks the most interesting anomalies, and dispatches one country-investigator per country, all in parallel. Each investigator gets the country name, its key data points, and a workpaper path in the task description. Each runs Shape B queries independently and writes to its own file (/workpapers/country_ireland.md, /workpapers/country_germany.md, etc.).
Cross-Reference. The orchestrator reads every workpaper and checks for contradictions: does the Ireland GDP figure match across the landscape scan, the expenditure decomposition, and the country investigation? If not, it dispatches the general-purpose subagent with a targeted verification query.
Synthesis. The orchestrator applies its analytical frameworks (expenditure decomposition, structural vs. cyclical classification, policy channel analysis), classifies each anomaly, identifies macro themes, and writes the final report to /final_report.md with unified [[n]] citation numbering.
How the agent runs
A full run takes 45 minutes and ~20 API calls. The agent builds complete quantitative coverage cheaply in Layers 1 and 3a, where Shape A queries batch well; identifies the interesting stories in Layer 2; and concentrates its budget on those in Layer 3b. Every country gets hard numbers in the final report; only the real anomalies get the deep treatment.
Running the agent
import asyncio
from finance_research.agent import run_finance_research

report = asyncio.run(run_finance_research(
    query="Using the latest available GDP data for 2025, analyze each country "
          "within the EU economic zone. Highlight those that are increasing or "
          "decreasing at an anomalous rate.",
    preset="gdp",
))
Why observability matters for this agent
A full run involves roughly 20 Finance Research API calls and dozens of orchestrator decisions: which Shape A queries to fire, which countries get Shape B follow-ups, whether Ireland's GDP print reflects domestic activity or MNC distortion.
The trace is the record that survives the run. Any claim in the final report traces backward to the specific Finance Research API call that produced it, and from there to the primary source URL. Three regulatory frameworks make this non-negotiable for FSI deployments:
- MiFID II: records obligations require firms to document the basis for investment recommendations, including AI-assisted research inputs
- DORA: third-party ICT oversight requires ongoing monitoring of what each vendor returned, on what input, and with what confidence; incident reporting windows require fast root-cause access
- EU AI Act (Article 12): high-risk AI systems must maintain automatic event logs sufficient for post-hoc review
What LangSmith captures
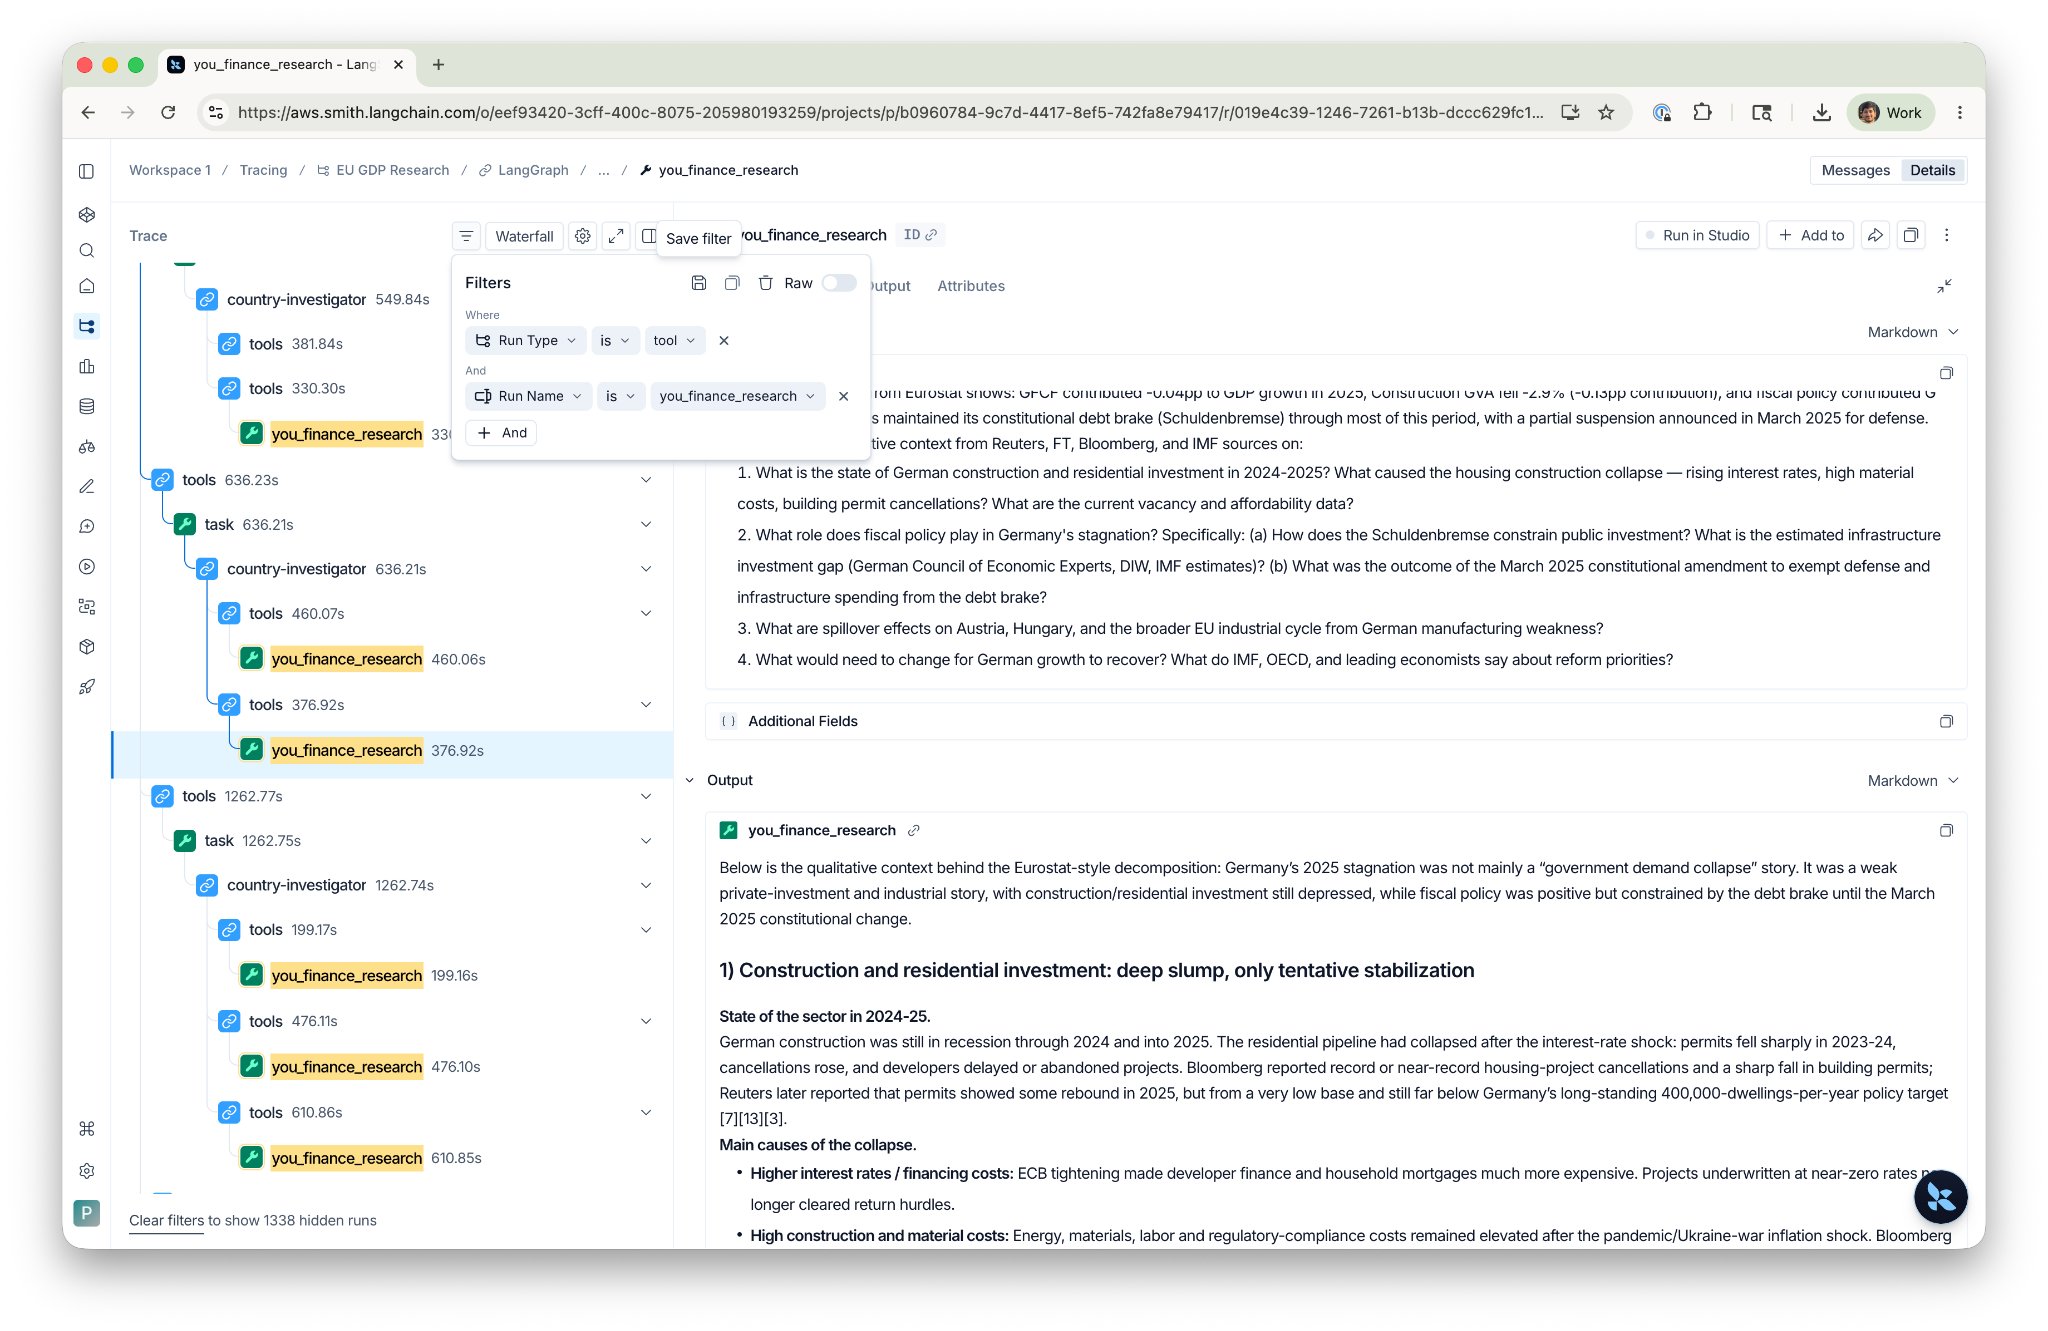
The trace is built automatically without writing any instrumentation code. Every run produces a nested trace tree: orchestrator → task dispatch → subagent → you_finance_research call → response. At each node, LangSmith records input/output content, token counts (input, output, cache read, cache creation), latency, and cost. For the LLM calls, that includes the full prompt, completion, and model parameters. For tool calls, it's the arguments and return value.
The practical upshot: you can click into any subagent's you_finance_research call and see the exact query, the effort level, the full cited response, and the source URLs. You can then click up one level to see how the subagent used that response in its workpaper. Any claim in the final report traces backward to the specific API call that produced it, and from there to the primary source URL.
LangSmith's dashboards give you this view aggregated across runs, not just within a single trace. Out of the box, every project gets charts for trace count, latency percentiles (p50/p90/p99), error rates, total cost, token breakdown, and tool call frequency by name. You can build custom dashboards on top. For example, tracking the cost of Layer 3b country investigations over time, or the error rate of you_finance_research calls grouped by subagent.
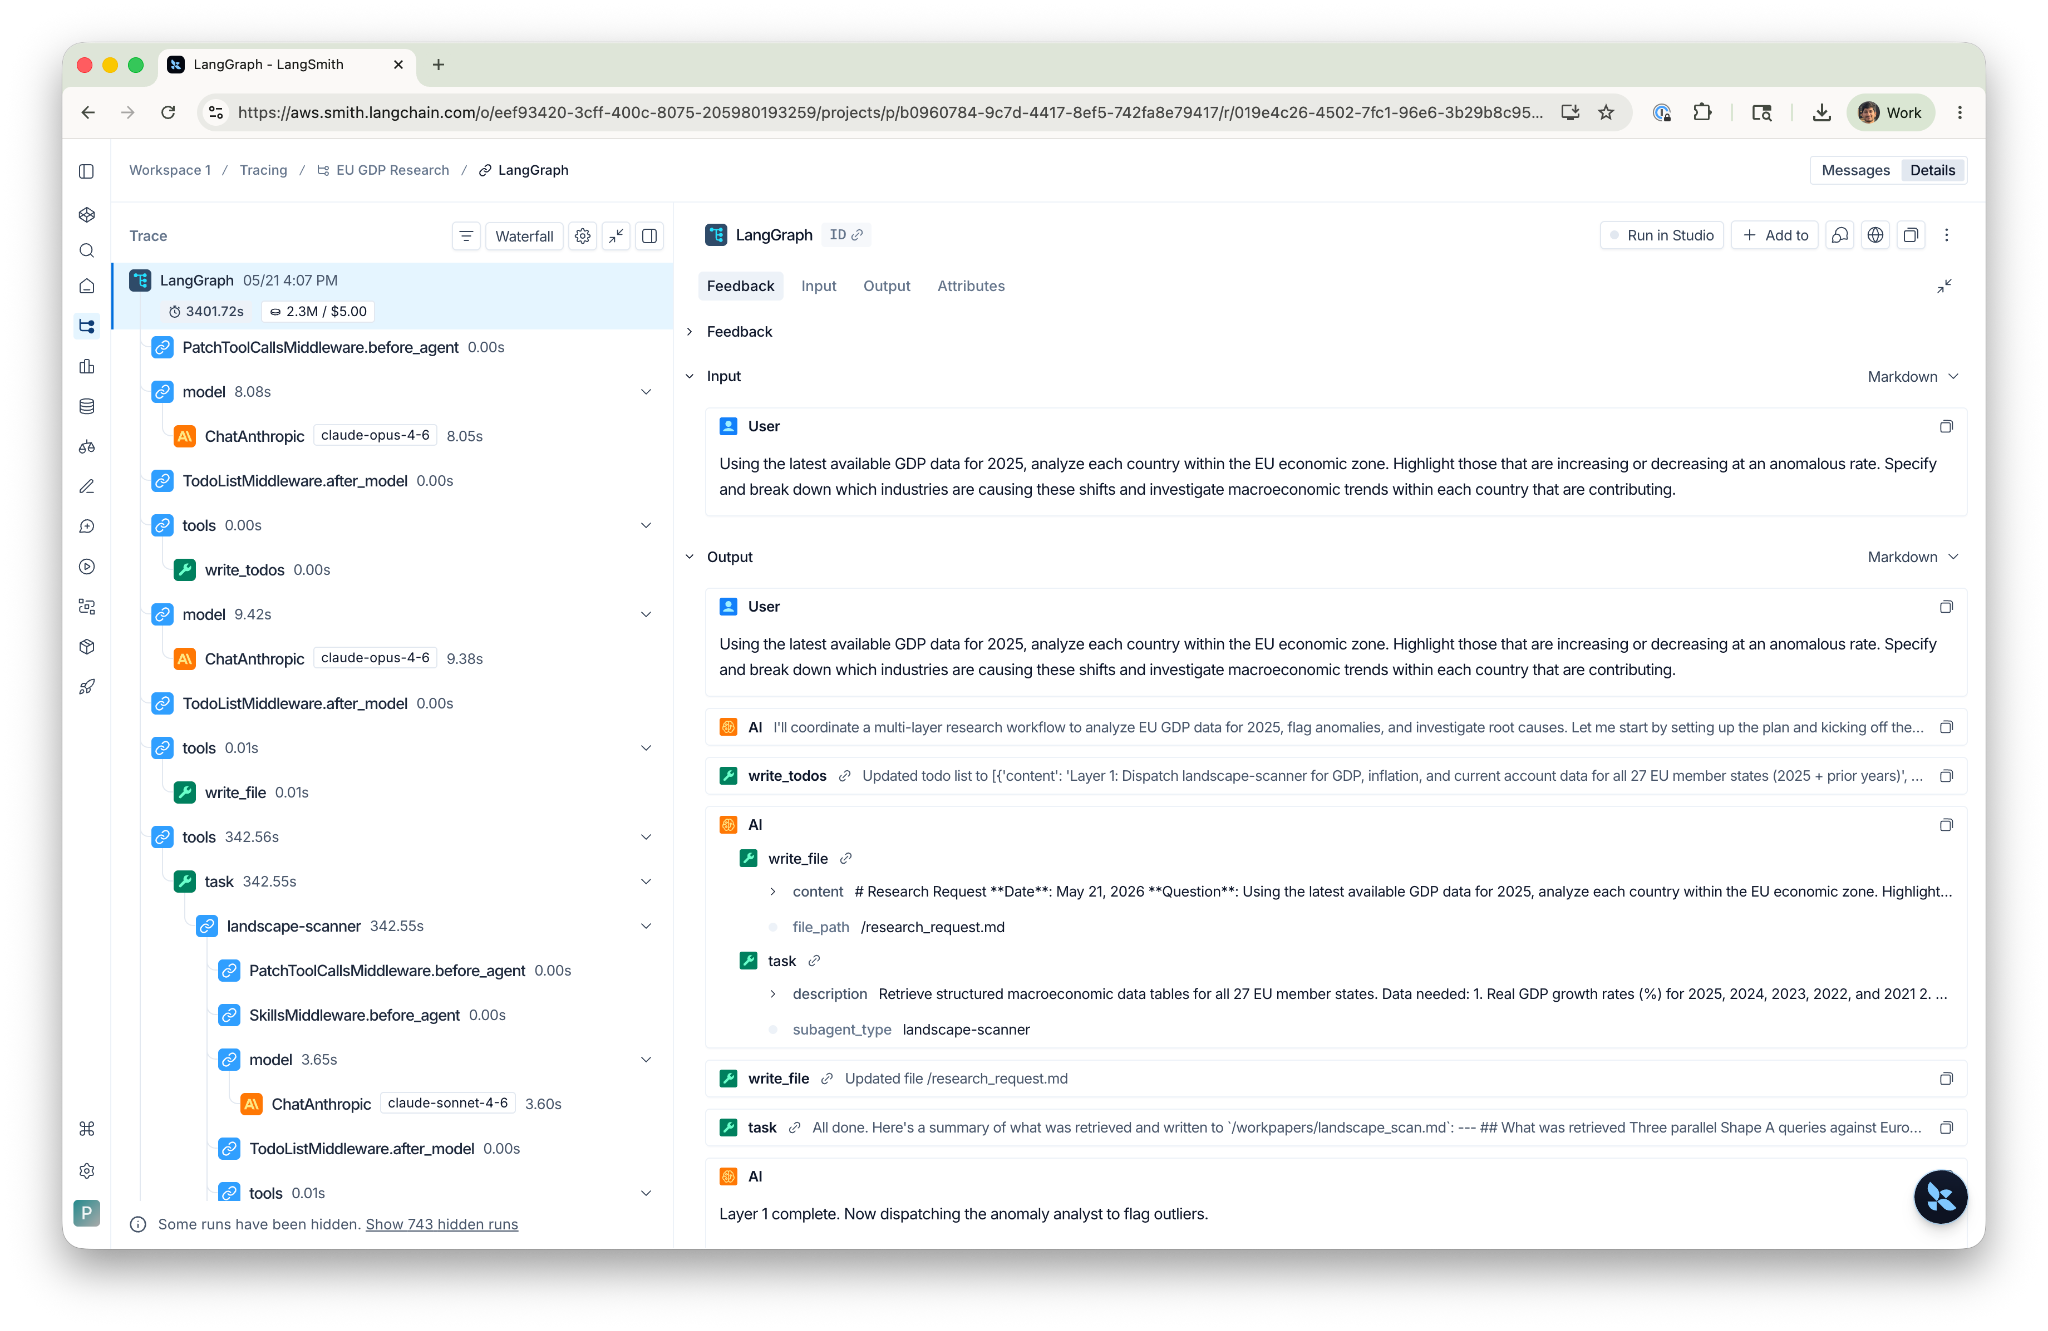
What the trace shows
The first thing in any run is the orchestrator's write_todos plan, the research strategy laid out before any subagent fires.
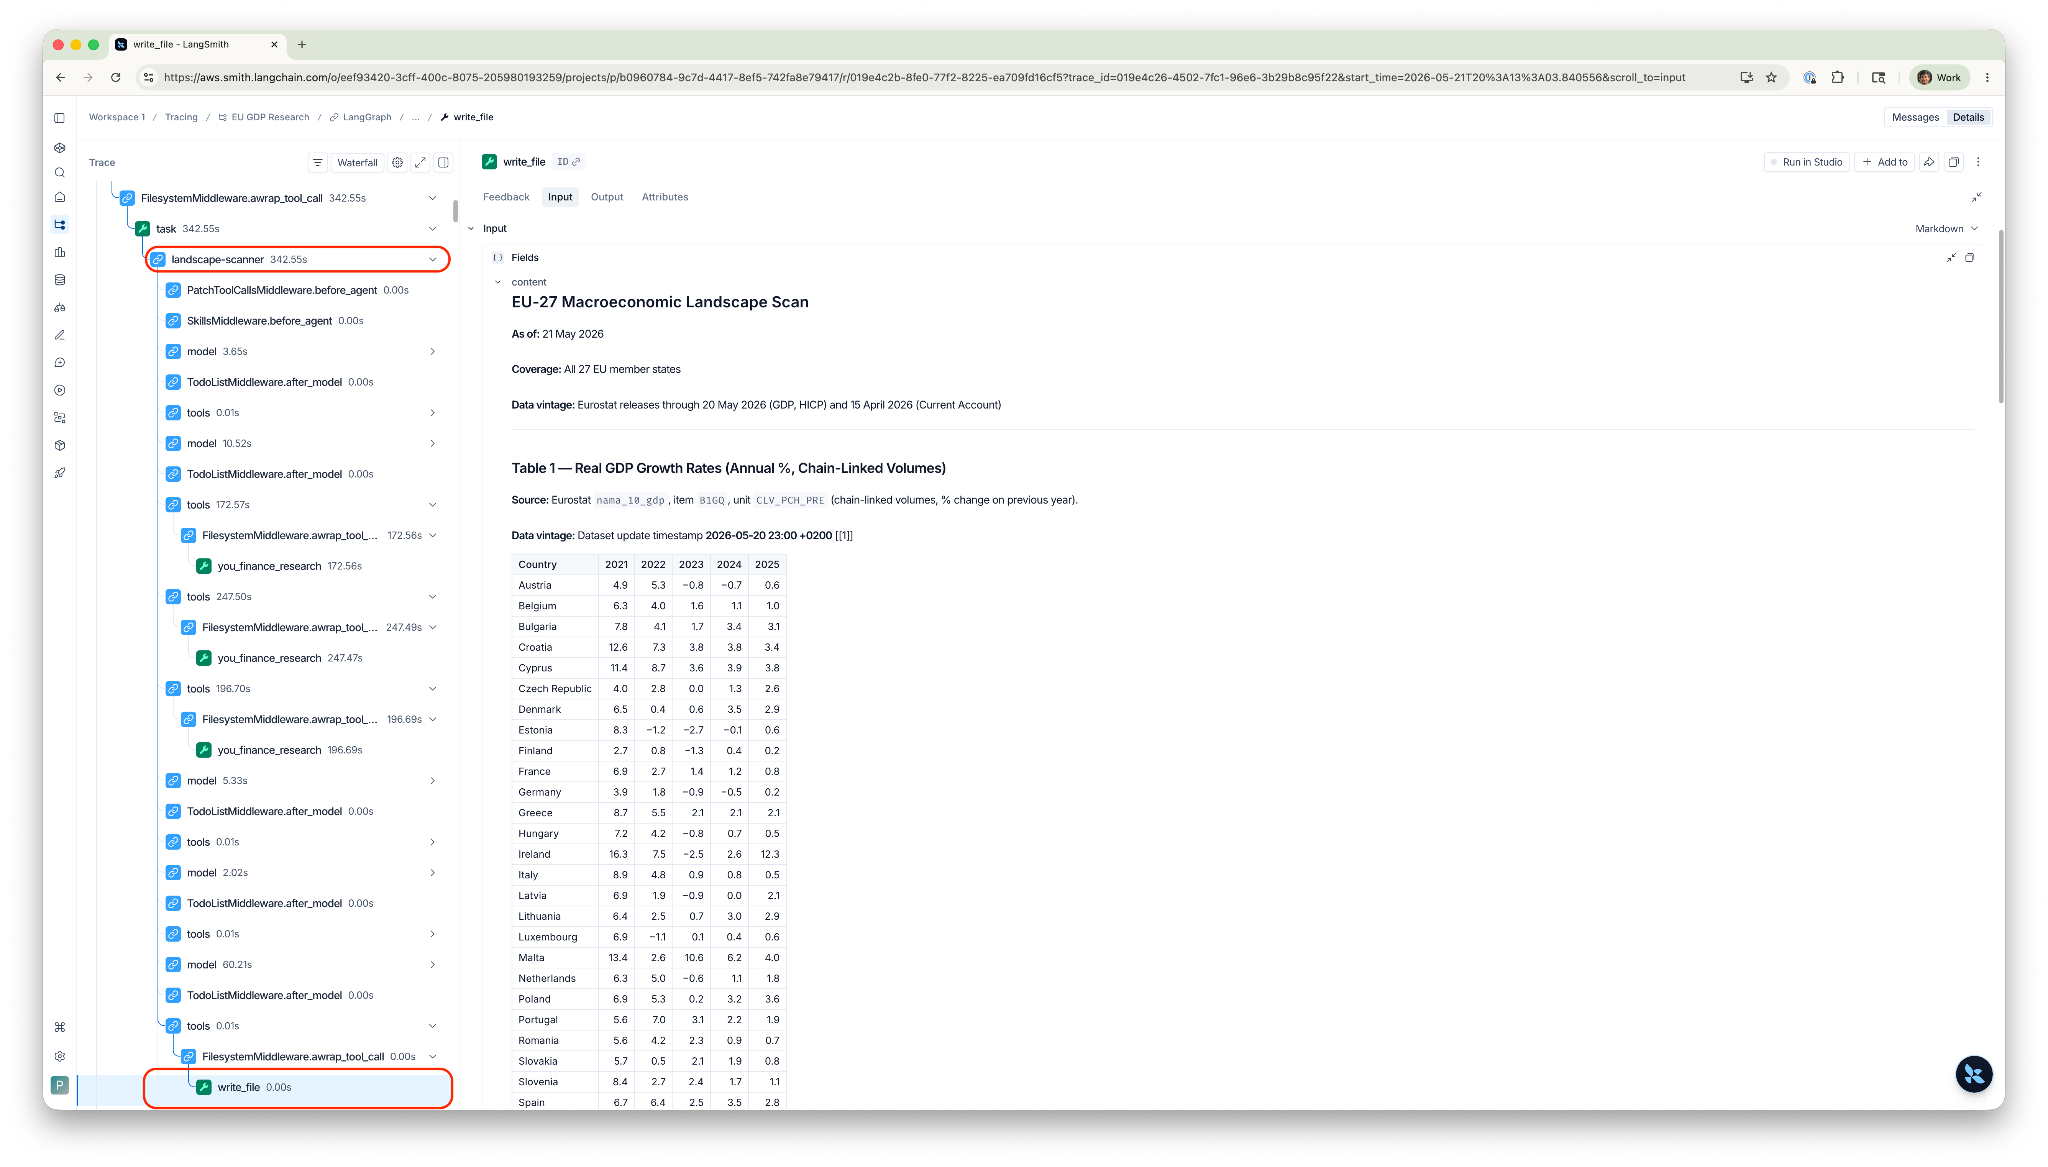
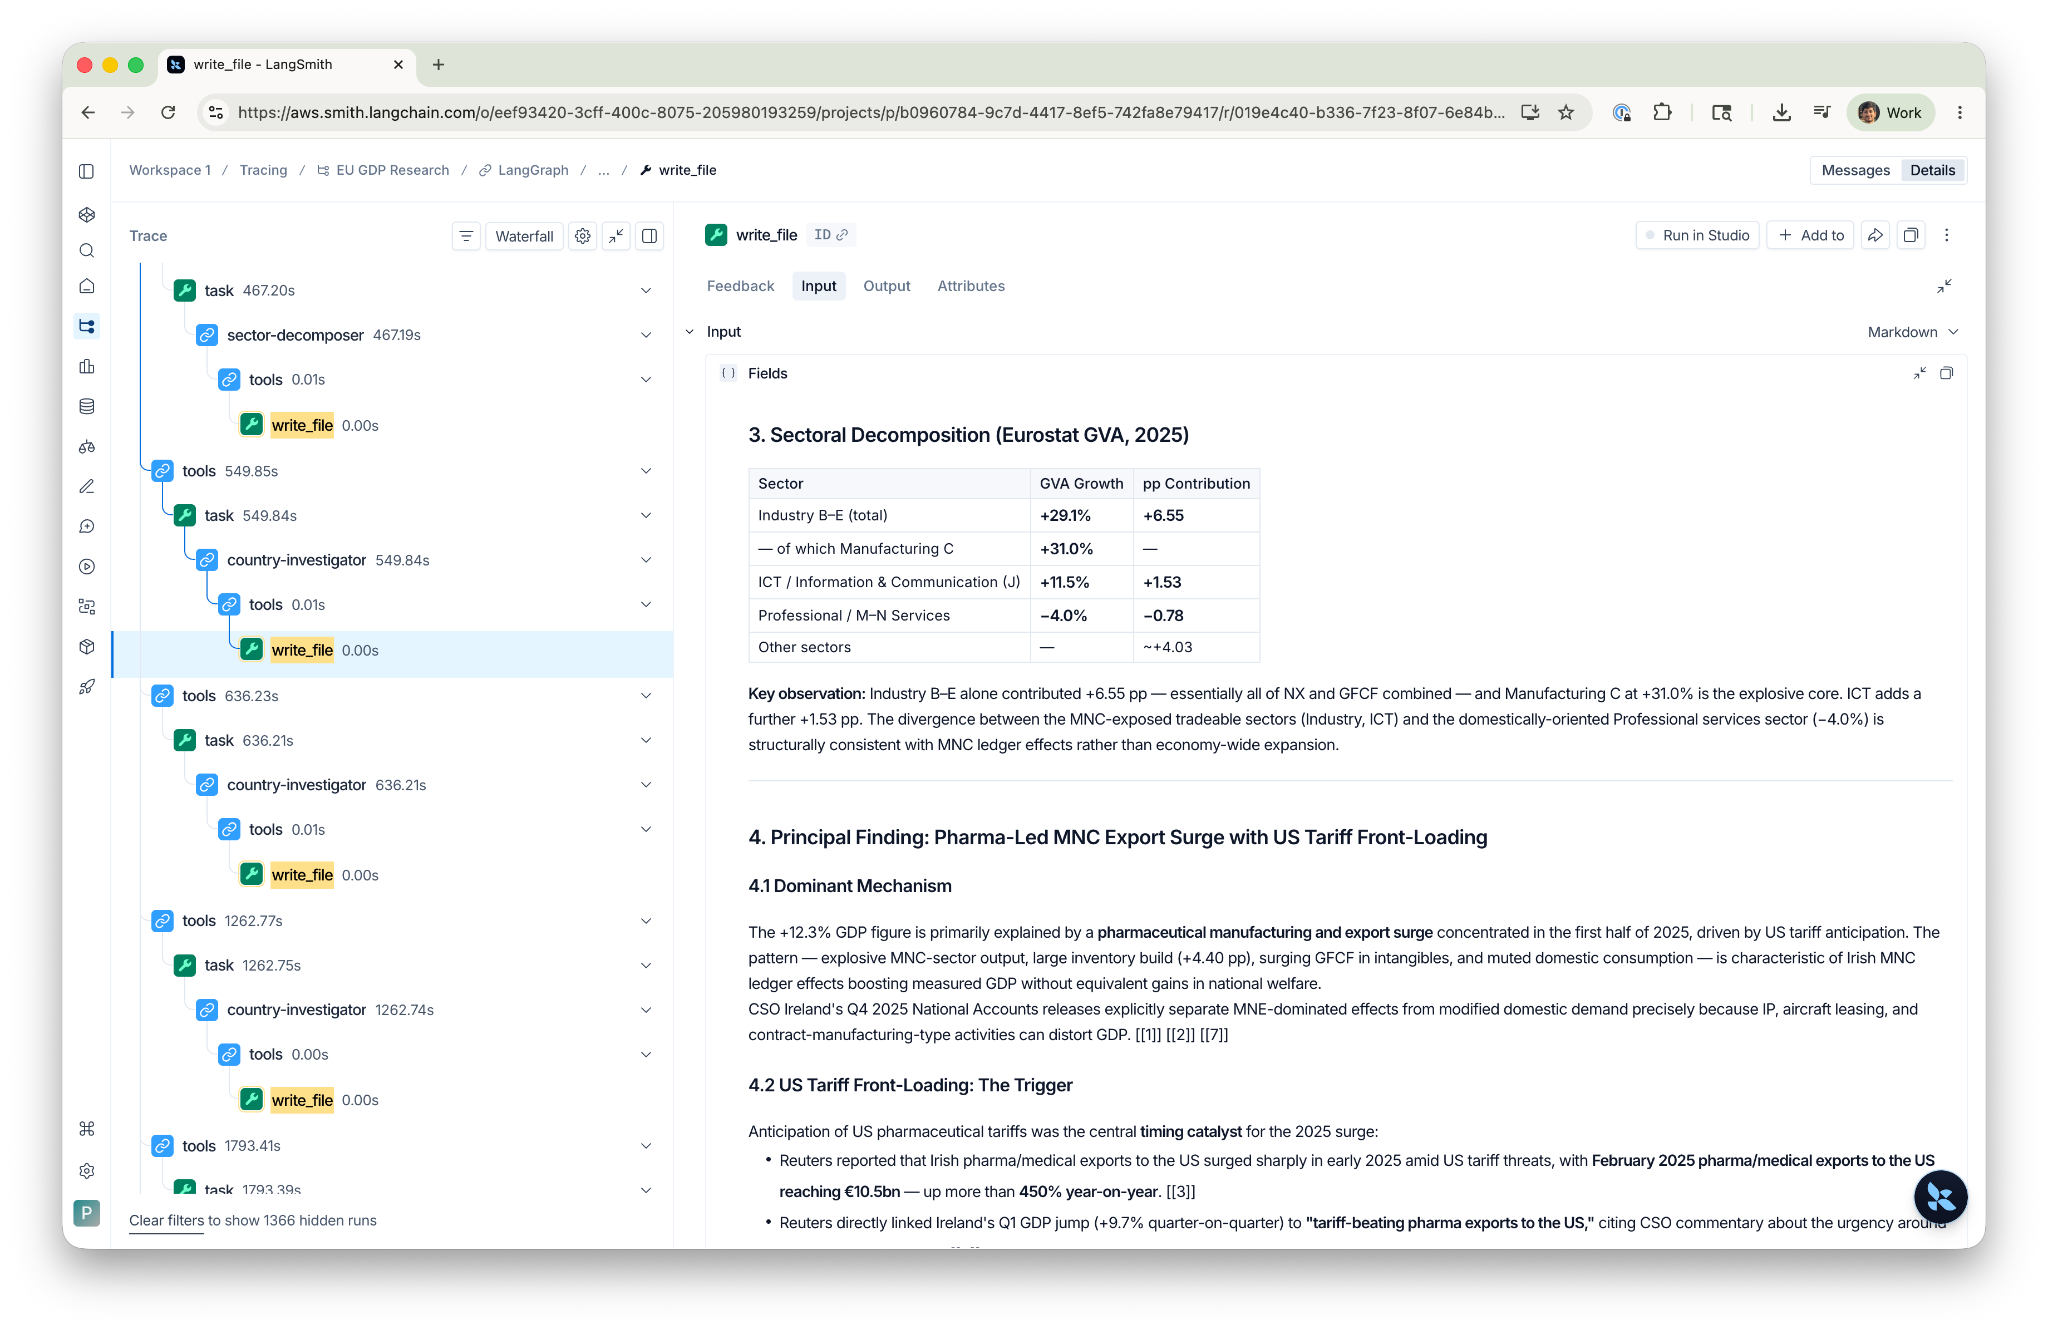
Layer 1 dispatches landscape-scanner. Click into the task node and you see the subagent's Shape A queries, the data tables that came back, and the write_file call that committed results to /workpapers/landscape_scan.md.
Then, the orchestrator dispatches anomaly-analyst. Its trace shows the read_file loading the landscape workpaper, the statistical computation, and the write_file saving the analysis with a JSON block that the orchestrator parses for investigation targets.
Layer 3a shows expenditure-decomposer and sector-decomposer running concurrently, each with their own Finance Research API calls. Layer 3b shows the country-investigator fan-out: multiple task nodes in parallel, one per country, each with its own Shape B queries and workpaper write.
The cross-referencing step shows the orchestrator reading every workpaper, comparing figures, and deciding whether to fire verification queries. Synthesis shows the final write_file to /final_report.md.
What lands in /workpapers/
Every run produces 14 files:
- landscape_scan.md: GDP tables for all 27 member states with inline citations and the JSON block the orchestrator parses to select investigation targets.
- anomaly_analysis.md: Outlier classification, structural vs. cyclical flags, and the ranked list of countries dispatched to Layer 3.
- expenditure_decomposition.md and sector_decomposition.md: Parallel Layer 3a workpapers, each with a full breakdown table.
- country_[name] (one per anomalous country): GDP trajectory, expenditure and sector decomposition, principal finding with named mechanism, forward-looking risk assessment, and [[n]] citations throughout.
See a full example workpaper in the GitHub repository →.
File system access is handled by Deep Agents' Backends: a pluggable filesystem interface that gives each agent read_file, write_file, edit_file, ls, glob, grep backed by whatever storage you configure. For local development: FilesystemBackend(root_dir="."). For production: StoreBackend routes to Redis or Postgres via LangGraph's store interface.
Evaluating the agent
A research desk runs this agent on a recurring schedule: weekly GDP updates, monthly sector rotations, ad-hoc deep dives before allocation meetings. Over dozens of runs, pattern-level questions emerge that no single trace resolves: is the Finance Research API returning thinner results on certain countries? Does the 2.0 pp anomaly threshold flag too many countries in volatile quarters? Would Sonnet perform as well as Opus for the orchestrator at half the cost?
LangSmith's evaluation framework is built for this, and applies in five ways:
Offline experiments. Build a dataset of test queries with reference outputs. This can include past reports the team has validated. Run the agent against the dataset, score with evaluators, and get aggregate results. Then swap the orchestrator's core LLM, or change the anomaly threshold from 2.0 pp to 1.5 pp, and run the same dataset again. LangSmith's comparison view shows the two experiments side by side, with regressions highlighted in red and improvements in green. You can drill into any row to see the traces from both runs next to each other.
Custom evaluators. You can write scoring functions tailored to this workflow. For example, checking whether every [[n]] citation in the final report maps to a valid source URL, or counting how many you_finance_research calls returned "insufficient" results. These run as part of the experiment and produce scores you can track over time.
Online evaluation. Attach evaluators to production traffic. LangSmith can automatically score a sample of live runs. For example, checking that the report includes required sections, that citation numbering is sequential, or flagging runs where a subagent hit a rate limit. Runs that match evaluation criteria get extended retention for investigation.
Annotation queues. When human review is necessary, like a report that's going to a risk committee, or an output where the agent's structural-vs-cyclical classification looks borderline, runs can be routed to an annotation queue. Reviewers score against a rubric, add corrections, and those corrections feed back into the evaluation dataset for future runs. Pairwise queues let reviewers compare two versions of the same report side by side.
Tool-level analytics. Filter runs across the project by tool name to aggregate you_finance_research performance: how often it returns useful results vs. rate limits vs. "insufficient" responses, average latency by query shape, and cost per call. This is how you'd notice that Shape B queries on Nordic countries consistently come back thin, or that one subagent is burning a disproportionate share of the API budget.
For production, you can set alerts on these metrics: flag if error rate exceeds 5% in a 15-minute window, if average latency spikes, or if per-run cost crosses a threshold. Alerts go to Slack, PagerDuty, or a custom webhook.
Getting started
# Clone the reference template
git clone https://github.com/youdotcom-oss/langchain-deepagents-finance-research
The Finance Research API is available via the langchain-youdotcom package, or as a hosted MCP server at https://api.you.com/mcp (docs). Get your API key → See the integration docs →
# Your You.com API key
export YDC_API_KEY=you.com_api_key

# At least one model provider
# Choose from several other LLM providers
export FIREWORKS_API_KEY="your_api_key_here"

# Enable LangSmith traces
export LANGCHAIN_API_KEY=langchain_api_key
export LANGSMITH_TRACING=true
export LANGSMITH_ENDPOINT=https://aws.api.smith.langchain.com
export LANGSMITH_PROJECT="My LangSmith project"

# Install dependencies
pip install deepagents langchain-youdotcom langchain-mcp-adapters langchain-fireworks

# Run the agent.
python examples/eu_gdp_analysis.py
To run this example, you’ll need a LangSmith account (start for free →), a You.com API key (sign up at you.com →, all new accounts come with $100 in free API credits), and an Fireworks API key.
You can use several other models already available inside LangChain. To swap in a different model, set its API key, install the corresponding LangChain package, and update the model string in the agent and subagent definitions.
Full documentation, including how to configure the anomaly detection threshold and customize the country scope, is in the integration docs →.
Who this is for
This architecture fits any team running structured multi-step research on financial subjects: deal screening at PE firms, credit underwriting at banks, KYB onboarding at compliance teams, macro positioning at asset managers. The five-subagent structure here is a starting point. Add or swap tracks to fit your workflow: management background checks for compliance-heavy diligence, IP portfolio analysis for M&A screening, earnings signal aggregation for equity research. Each new track is one additional subagent dict with a focused system prompt and the same you_finance_research tool.
A no-code version is coming to Fleet, LangChain's UI-driven platform for building and managing agents.
For benchmark methodology and accuracy details, see the Finance Research API overview →
Ready to build? Get your API key → Finance Research API docs → Reference implementation on GitHub →
Additional Resources
- LangSmith Fleet documentation →
- You.com integration page in LangChain docs →
- Learn more about Deep Agents
- Learn more about You Finance Research API