test article
description text test
AI observability requires domain experts, not just dashboards
Most AI observability tools for agentic applications answer the question engineers ask:
"Is the system working?"
The harder question is one engineers can't answer alone:
"Is the output actually good?"
As agentic systems move from prototypes to production, observability needs to expand beyond infrastructure health. The question is no longer just whether the LLM responded, but whether the generative AI output met the standard your domain experts expect.
What is AI observability?
AI observability is the practice of collecting, analyzing, and correlating telemetry data (logs, traces, and metrics) across the full AI technology stack to understand how AI systems behave in production. It enables real-time visibility into LLMs, AI agents, orchestration layers, and their downstream impact on applications and infrastructure.
But this definition alone doesn't capture the full picture. Most definitions stop at "visibility into system behavior," which is where traditional APM left off a decade ago. The harder part, and what separates AI observability from a rebranded monitoring dashboard, is understanding whether the system is doing something useful for users. That requires a layer of insight that telemetry alone cannot provide.
The three pillars, and why they're only the starting point
AI observability inherits the three pillars from traditional software observability, each adapted for AI-specific workloads:
- Logs: Time-stamped records of application events used for troubleshooting and debugging. In AI systems, logs capture prompt submissions, model responses, tool invocations, retrieval events, and error states across multi-step agent workflows.
- Traces: End-to-end records of a request's journey through the system, from user input through orchestration, model inference, tool execution, and back. For agentic applications, traces capture the full reasoning chain, including branching decisions, retries, and intermediate outputs that shaped the final response.
- Metrics: Quantitative measures of system health over time such as latency and error rates. AI-specific metrics extend this to token consumption, inference cost, model response times, tool call latency, and feedback scores.
These three pillars give teams the vocabulary for understanding system behavior. But AI systems produce telemetry that stretches well beyond what logs, traces, and metrics were originally designed to capture. The gap between traditional observability and AI-specific observability is where most teams get stuck, and where the most AI-specific failures hide.
AI-specific telemetry: what traditional pillars miss
Token usage and cost attribution
Tokens are the fundamental unit of AI compute. Every prompt and response is broken into tokens that directly determine cost and latency. But token observability goes beyond tracking spend.
Key metrics include token consumption rates across models and inputs, and input and output tokens per trace. Teams tracking token usage at a granular level can attribute costs to specific features, users, or use cases, which makes cost optimization targeted rather than speculative.
However, token optimization solves a cost problem, not a quality problem. A team can reduce token consumption by 40% and still produce outputs that domain experts reject. This is the first hint that engineering metrics, no matter how comprehensive, address only half of the observability challenge.
Model drift
Model drift occurs when AI models gradually change behavior as the data they encounter in production diverges from the conditions they were built for. For teams using managed AI platforms, drift can also occur when providers update models without notice. A response that worked reliably last month may subtly degrade after a provider-side model update.
Key indicators include changes in response patterns over time, output quality degradation on previously reliable prompts, and shifts in latency that suggest the model is handling inputs differently. Drift is hard to catch because it's often gradual. No single response looks broken, but quality erodes over weeks.
This is where AI observability starts to demand more than dashboards. Engineers can detect drift in aggregate metrics as average response length changes, latency distributions shift, and token usage patterns evolve. But domain experts are often the first to notice output quality degrading in the specific contexts that matter most to users. A clinician notices that medication summaries are missing interaction warnings more frequently. A lawyer notices that contract analyses are citing outdated precedent. These signals arrive as anecdotes before they appear as trends, and without a structured mechanism to capture them, they get lost.
Response quality metrics
Response quality is where AI observability diverges most from traditional application monitoring. The metrics that matter include:
- Hallucination frequency across prompt types and models. Not just whether the model hallucinates, but where and how often.
- Factual accuracy, which often requires human validation or checking correctness with AI.
- Output consistency for similar inputs. Does the system produce reliable results, or does the same question yield different answers depending on phrasing?
- Relevance to user intent. Did the output actually address what the user was asking, or did it answer an adjacent question confidently?
- Latency-accuracy tradeoffs. Faster responses that sacrifice quality may look good on dashboards while frustrating users.
Most of these metrics share a common characteristic: they're difficult or impossible to evaluate fully without domain expertise. Automated scoring can approximate quality, but the ground truth for "was this output correct?" frequently lives in the minds of subject matter experts, not in a metrics pipeline.
What AI observability covers across the stack
Effective AI observability gives you end-to-end visibility across the full lifecycle of AI systems, from user input through orchestration, LLM calls, tool usage, and final output. Without this end-to-end trace, teams can troubleshoot isolated components but struggle to understand how the entire AI system behaved.
AI observability spans multiple layers of your technology stack. Each layer captures different signals, and together they form a complete picture of system behavior.
Application layer
Application-level AI observability tracks user interactions and business outcomes. This is where you measure whether AI features are actually being used, and how AI outputs connect to the metrics your business cares about, such as conversion rates, time-to-resolution, and user satisfaction.
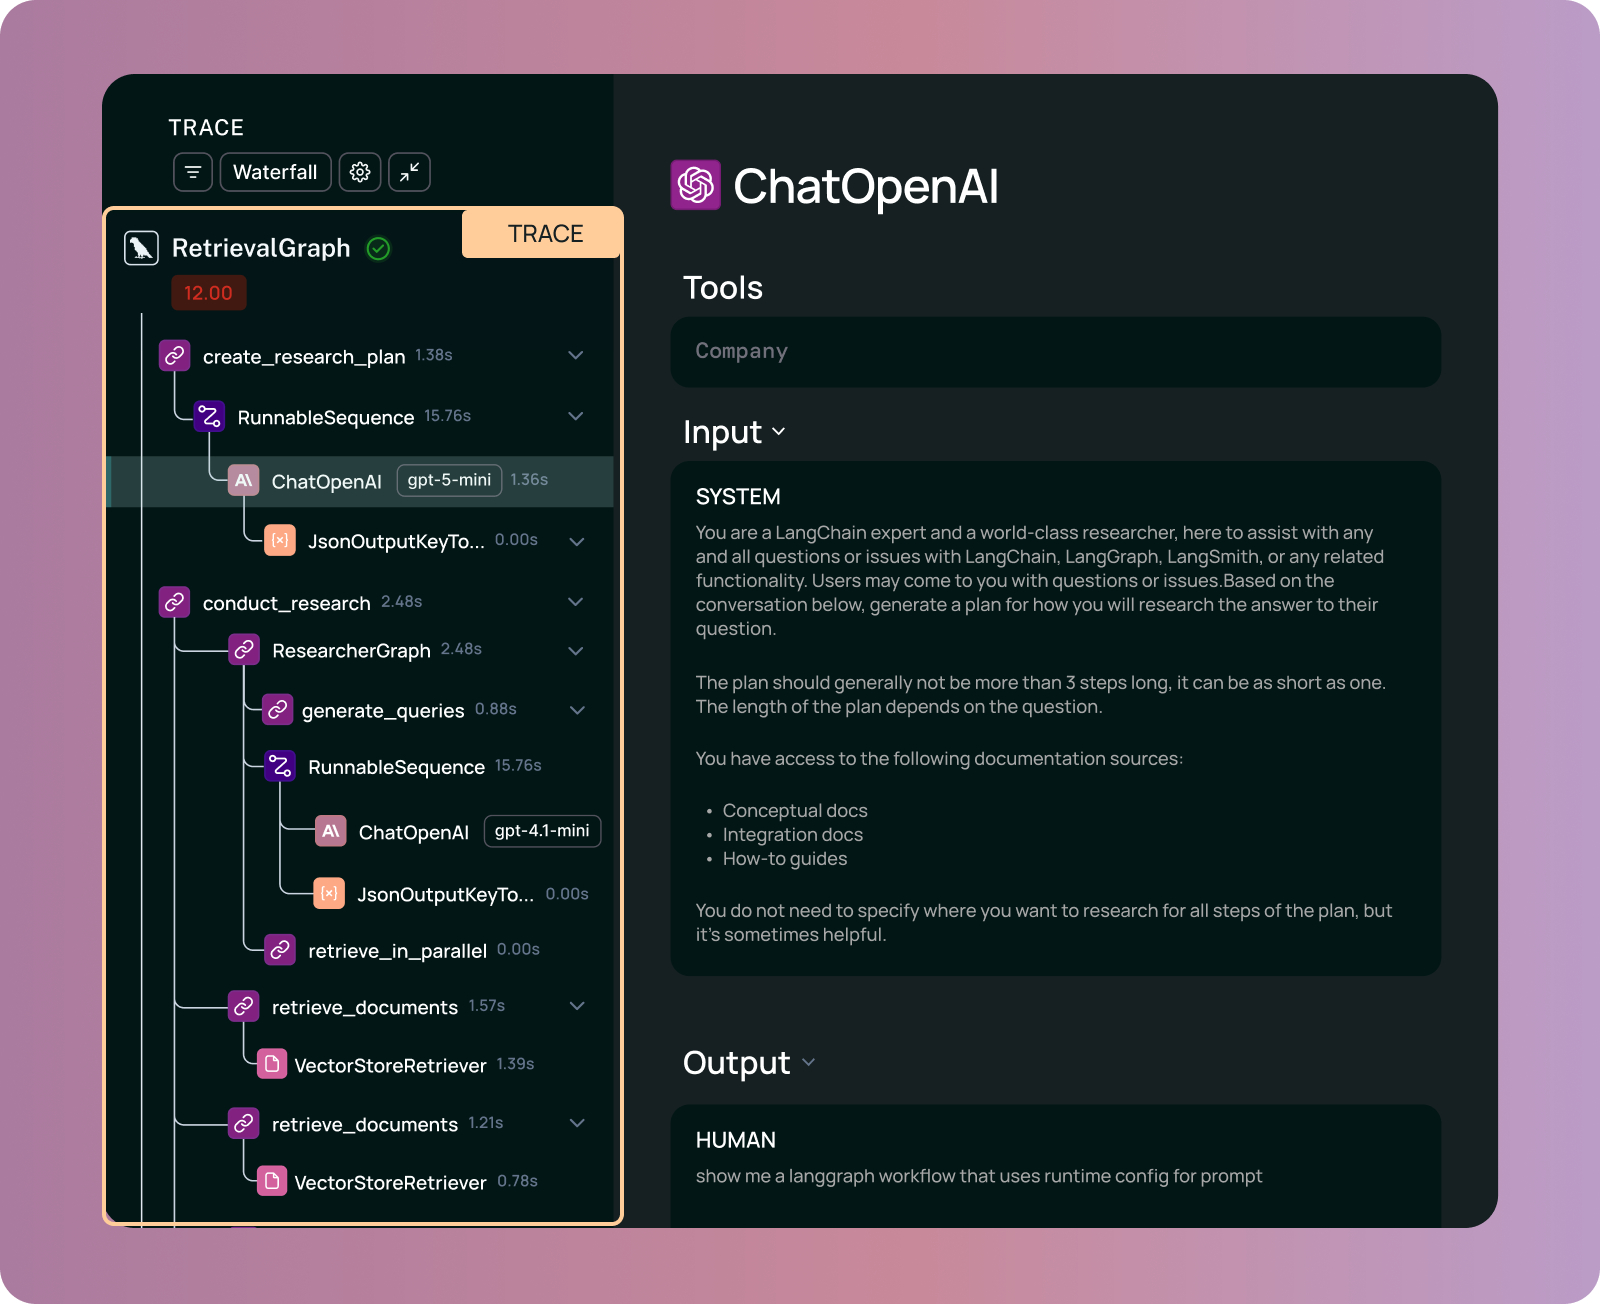
Orchestration layer
The orchestration layer manages LLM calls, tool selection, and decision logic, whether you're using LangChain, LangGraph, or custom pipelines. Observability priorities include tracing prompt/response pairs, monitoring retries and fallback behavior, tracking tool execution timing, and understanding branching logic. When an orchestration step fails or produces unexpected results, the trace needs to show exactly which decision led to the downstream problem.
Agentic layer
The agentic layer is distinct from orchestration because it handles multi-step reasoning, autonomous workflows, memory, and goal-directed behavior. Observability priorities include tracing reasoning chains across steps, monitoring memory references and context management, tracking tool usage history and decision logs, and capturing intermediate outputs that influenced the final response.
This distinction matters because agent failures compound across steps. A flawed retrieval in step two shapes the reasoning in step five, which determines the tool call in step eight. Without agentic-layer observability, you see the final bad output but can't trace it back to the decision that caused it. This compounding effect is one of the strongest arguments for treating agents as their own observability concern.
Model and LLM layer
Model-level AI observability captures prompts, completions, token usage, latency, and associated metadata. For teams deploying multiple AI models in parallel, observability must also track which model version generated each output, how different LLM configurations compare, and where performance diverges across environments.
Working with managed AI platforms (OpenAI, Anthropic, Gemini, Bedrock, Azure AI Foundry, Vertex AI) introduces an additional challenge: model execution happens externally and opaquely. You can observe inputs and outputs, but you can't inspect what happens inside the model. This makes external observability even more critical and reinforces why domain expertise is essential. When you can't see inside the model, the quality of its outputs is the primary signal you have.
Semantic search and vector database layer
RAG components and vector databases (Pinecone, Weaviate, FAISS, Chroma, and others) form a critical layer that many observability implementations underinvest in. Observability priorities include embedding quality and consistency, retrieval relevance scores, result set sizes, query latency, and semantic drift, where the meaning of queries evolves while your embeddings remain static.
Retrieval quality is where domain expertise matters most, because only a subject matter expert can judge whether the retrieved context was actually relevant to the query. An engineer can confirm that the vector database returned five results in under 100 milliseconds. A domain expert can tell you that three of those results were from the wrong regulatory jurisdiction and the other two were outdated.
Infrastructure layer
Infrastructure observability for AI workloads extends beyond traditional APM concerns. AI-specific infrastructure considerations for companies running open source models include GPU utilization and memory pressure during inference, cost breakdowns across compute tiers, network bottlenecks for model serving (especially when calling external APIs), availability and rate limiting of managed AI endpoints, and scaling behavior under variable inference loads. Teams running AI workloads need to understand how infrastructure constraints translate to user-facing quality. A GPU memory bottleneck might force smaller context windows, which degrades output quality even though the system technically "works."
Benefits of AI observability
When implemented well, AI observability delivers measurable returns:
- Cost control: Attribute token usage and compute costs to specific requests, models, users, and features, making optimization targeted rather than across-the-board.
- End-to-end tracing: Follow a request from user input through orchestration, model inference, tool execution, and output. This is critical for debugging failures in complex agent workflows.
- Failure mode identification: Catch latency spikes, tool failures, hallucinations, degraded retrieval quality, and cascading errors before they reach users.
- Model quality assurance: Use feedback signals, correctness scores, and grounding metrics to track whether model performance is improving or regressing.
- SLA and compliance tracking: Monitor performance and reliability of AI workflows against contractual and regulatory requirements.
These benefits are real, but they address only the engineering side of the equation. Cost control doesn't tell you whether the output was worth the cost. End-to-end tracing doesn't tell you whether the trace produced a correct result. Failure identification catches system failures but misses the domain failures that erode user trust without triggering any alert.
The role of OpenTelemetry
OpenTelemetry has become the standard open-source framework for collecting and transmitting telemetry data, and its role in AI observability is growing. For teams building AI systems, OpenTelemetry offers vendor independence (avoiding lock-in to any specific observability platform) while providing end-to-end visibility across complex pipelines that span multiple models, services, and infrastructure components.
OpenTelemetry is valuable when working with managed AI platforms where model execution happens externally. It enables metadata standardization across multi-vendor AI solutions, so traces from your orchestration layer, your vector database, and your managed LLM endpoints can be correlated in a single view. For teams running heterogeneous AI stacks (and most production teams do), this interoperability matters.
The adoption gap: tracing without evaluation
As agentic applications mature, observability must account for both system health and output quality. Teams build observability around engineering metrics because that's what engineering teams can act on. Latency, error rates, and token costs are measurable, debuggable, and within the engineer's control.
But engineering metrics alone miss failures that require domain knowledge to detect, where "correct" is defined by expertise that lives outside the codebase. This gap becomes more pronounced as teams deploy AI agents that reason across multiple steps. When AI agents call tools, retrieve context, and chain LLM decisions together, quality failures compound in ways traditional monitoring cannot capture.
The below chart shows agent observability adoption for all organizations surveyed in our State of Agent Engineering survey vs. teams with production agents:
These adoption numbers show a pattern: teams have built this infrastructure. The question becomes what to do with it. High observability adoption with lower evaluation adoption (52% offline, 37% online) suggests the market has largely adopted tracing but hasn't yet linked traces to systematic quality improvements.
This reflects a broader shift across the LangChain ecosystem toward production-grade evaluation. The standard toolkit includes:
- Tracing: Capturing the complete execution tree of an agent, including tool selection, retrieved documents, parameters passed to the model at each step, and the dependencies across those components
- Monitoring dashboards: Tracking cost, latency, and error rates in real time
- Alerting: Notifying teams when metrics cross thresholds
- Usage analytics summaries: Understanding how and why users interact with AI features
These tools answer whether the API call succeeded, how long it took, and what it cost. But they don't reveal whether the output was actually useful to the user.
Why traditional engineering metrics aren't enough for AI observability
AI systems rarely fail in ways that resemble traditional software outages. Instead of crashing, LLMs confidently produce plausible but incomplete answers. Instead of throwing exceptions, AI agents may follow incorrect reasoning paths even when all traditional observability metrics appear healthy.
In these cases, existing dashboards from legacy APM providers fail to reflect true model performance. AI applications also fail in ways that latency dashboards and error rates don't capture. For example:
- A medical summary that returns in 200 milliseconds, costs exactly what you budgeted, and still misses critical clinical context that changes the diagnosis.
- A legal research tool that retrieves documents without errors while citing a precedent that was overturned three years ago.
- A financial risk report that completes successfully and passes all validation checks while using an outdated volatility model that underestimates market exposure.
In each case, every engineering metric looks healthy, yet the output is still wrong.
Domain failures produce outputs that are technically correct by engineering standards but wrong by the standards of the people who actually use them. Engineers have the systems to improve AI applications, but domain experts define what "good" means. Without a shared workspace connecting them, improvement becomes guesswork.
The below table describes a system failure versus a domain failure for agentic systems.
Many organizations have instrumented some form of observability for their agents and AI systems but haven't yet built the human feedback loops that improve agent quality over time. Observability tells you what happened. Evaluation determines whether your generative AI application is improving. For AI product and engineering teams, this shift from monitoring to measurable quality is what separates experimentation from production readiness.
Where domain feedback gets lost
In most organizations, subject-matter expert feedback flows through indirect channels. We hear this pattern repeatedly in customer conversations, e.g.:
A support engineer at a financial services company notices that a customer-facing risk report labeled a transaction as "low risk" even though the underlying analysis flagged three separate compliance concerns: unusual transaction timing, jurisdictional red flags, and a counterparty with recent regulatory scrutiny. The engineering lead files a ticket noting the inconsistency, but without structured feedback, the issue sits in a backlog alongside dozens of other ambiguous bug reports.
Meanwhile, the customer acts on the "low risk" classification, and two weeks later, the transaction triggers a regulatory inquiry. The compliance team traces the issue back to the AI-generated report, but by then, the damage is done: the inquiry costs time, money, and credibility with regulators. The AI system never crashed. Latency was fine. Token costs were within budget. But the output was wrong, and no traditional dashboard caught it.
For teams building complex AI agents, this problem compounds. A single flawed LLM decision early in a chain can propagate through downstream tool calls, yet without structured review, no one captures that failure as a training signal for the broader AI system.
Each of these moments contains a useful signal about what "good" means in that domain. But the feedback doesn't become a test case, an evaluation criterion, or a dataset for regression testing. The insight gets buried in ticket backlogs and competing priorities, replaced by new fires to fight.
The gap exists because of a team’s workflow and tooling, rather than lack of knowledge on the team. In many organizations, engineers don't have a place to send domain experts for structured review and domain experts don't have a way to provide feedback that engineering systems can consume. The result is that AI improvement relies on engineers guessing which problems matter most, and acting on whatever anecdotes happened to reach them that week.
Annotation queues as a collaboration surface
Annotation Queues provide the mechanism that connects domain expertise to engineering workflows. The concept is straightforward: production traces get routed to queues where subject matter experts can review outputs in context, add ratings, leave comments, and flag issues. The expert doesn't need to understand the trace structure or write code. They evaluate whether the output is good for their domain.
This is especially critical for teams deploying AI agents in production. As AI agents orchestrate multiple LLM calls and tools, troubleshooting shifts from fixing a single prompt to understanding how the full system behaved across steps.
Here's how the workflow operates in practice:
An engineering team configures routing rules based on criteria they care about:
- Sample 10% of all traces
- Route all traces with negative user feedback
- Send all traces for a specific use case to a specific queue
- Queues can be configured with granular access control to ensure the right experts review the right traces.
Domain experts receive notifications that traces are ready for review. They open the queue, see the actual prompt and output in context, and provide structured feedback -- a rating on a defined scale, comments explaining their reasoning, and flags for specific issues.
This transforms observability from something engineers browse alone into a shared workspace. The trace view serves as a shared visualization layer for engineers and domain experts.
- The engineer sees the full trace: every tool call, every retrieval, every step in the reasoning chain.
- The domain expert sees what matters to them: the input the user provided and the output the system returned.
- Both perspectives reside in the same place and are connected to the same underlying data.
Traditional observability shows what happened. Annotation Queues add a follow-up and help answer the question, "was it right?" That question invites domain experts, such as Product Managers, into the engineering process without requiring them to become engineers.
From feedback to evaluation criteria
When domain experts review traces and add ratings, comments, or flags, those annotations become inputs that engineering teams can use. The flagged example can flow directly into downstream workflows.
- Dataset entries: A trace marked "incorrect" with an explanation becomes a regression test case. The input-output pair links a dataset against which future model changes are evaluated. Over time, this transforms LLM observability into a structured automation pipeline in which human insight continuously informs model updates and agent behavior. It also enables AI-driven quality improvement rather than reactive debugging.
- Evaluation rubrics: Patterns in annotations show what domain experts check for. If clinicians consistently flag "missed drug interactions," that becomes an evaluation criterion that automated systems can check.
- Prompt improvement signals: Comments explain why something failed in terms that engineers couldn't have known. "This summary omits the contraindication because the source note used non-standard abbreviations," tells engineering exactly what to fix.
- Quality baselines: Aggregated ratings across hundreds of traces establish what "good" looks like quantitatively, enabling teams to measure whether changes improve or regress quality.
We see this as a development flywheel: traces flow to Insights Agent, which provides insights on common usage patterns. These insights inform dataset creation Datasets enable evaluations, evaluations drive improvements, and improvements produce new traces to observe. The flywheel relies on domain knowledge being entered into the system in a structured format. This closes the loop inside the broader AI development lifecycle, connecting production traces to iteration.
Here's what that looks like concretely: A clinician flags an output of a trace as incorrect, noting that the summary missed a drug interaction. An engineer clicks "Add to dataset." That input-output pair now runs against every prompt change. When an engineer modifies the prompt next week, the regression test catches whether the fix worked or whether it introduced new problems. The informal process of "someone mentioned this was broken, so let's try to remember to test for it" becomes a systematic quality gate.