AI Observability in the Agent Development Lifecycle
February 10, 2026
An AI agent can look healthy in production and still fail the task. The endpoint returns a 200 response, latency stays within range, and token spend looks normal, but the agent used the wrong tool, retrieved stale context, skipped a required approval step, or answered with a plausible error.
That gap is why AI observability needs to do more than watch dashboards. In the Agent Development Lifecycle (ADLC), teams build, test, release, and monitor agents as a continuous cycle. Once the agent is live, every request leaves behind a detailed record called a trace. Traces show what the agent actually did, where it failed, and which fix, test, or policy change should happen next.
What is AI observability?
AI observability is how teams understand whether AI agents are behaving correctly in production. It is the practice of collecting, analyzing, and correlating telemetry data across logs, traces, and metrics so teams can see how AI systems behave after deployment.
Traditional application monitoring asks whether the service is up, fast, and within budget. AI observability asks whether the AI agent completed the task in a way a user, product manager, compliance lead, or a domain expert would accept.
A useful trace gives the team enough context to pinpoint where the fix should happen: in the prompt (wording, instructions, or formatting), the retrieval layer (what context gets fetched), the tool path (which tools get called and in what order), the policy layer (rules and guardrails), or the evaluation set (tests that catch the failure next time).
What AI observability needs to capture
Start with logs, traces, and metrics
Logs, traces, and metrics are still the baseline, but AI agents add telemetry that traditional observability was not designed to interpret. Together, these three pillars give teams a shared vocabulary for production visibility:
- Logs capture prompt submissions, model responses, tool invocations, retrieval events, and error states across multi-step agent workflows.
- Traces show the request path from user input through orchestration, model inference, tool execution, retrieval, and final output.
- Metrics quantify system health over time, including latency, error rates, token consumption, inference cost, model response time, tool call latency, and feedback quality scores.
Capture the fields that make a trace actionable
A good trace should capture enough to recreate a bad run and turn it into a repeatable test. At a minimum, that means saving:
- What the user asked, and the answer the agent gave back
- Which AI model ran, and what information it was given to work with
- The steps the agent took, including the tools it used and any outside data it looked up
- How long the request took, and whether anything failed
- Any feedback or quality scores attached to the run, plus a flag if the agent broke a rule
How those pieces connect matters just as much as the pieces themselves. An agent usually works as a chain of steps, where each step feeds the next, so a useful trace keeps that order intact. It should show how a decision the model made led to the tool it called next, which piece of looked-up information shaped the final answer, and if an early mistake threw off everything that came after.
Tie telemetry to what the agent did
Knowing the system is up and responsive is not the same as knowing the agent did its job. To judge how an agent behaved on a given request, you need signals tied to the specific actions it took: what each step cost, where it slowed down, and whether the answer was any good.
Models charge per token, so token usage is your most direct cost signal. When you track tokens per request, and per step within a request, you can see which models, inputs, and workflow steps are driving spend.
Tool call latency shows where an external dependency slows the agent down. For agents, that usually means time spent waiting on a retrieval step, a third-party API, or an internal service. Tracking latency per tool call helps you find bottlenecks and decide whether to cache results, change providers, or redesign a slow step.
Feedback quality scores show whether the agent is getting closer to the behavior users expect. These scores can come from users (thumbs up/down), domain experts, or automated evaluators. The point is to turn “this answer was bad” into a measurable signal you can trend over time and use to trigger deeper review.
All these signals need to stay connected. For agents that use retrieval (RAG), the model might loop through search and reread steps multiple times before it finally calls a tool or writes an answer. Each retrieval loop adds more context, more latency, and more chances to pull in irrelevant or conflicting information. So even if the agent eventually picks the correct tool, the path it took to get there can still degrade the result: the model may spend its budget on extra context, anchor on an early bad document, or lose the thread of the original question.
The trace is what ties those signals together. It lays out the agent's path step by step, with cost, latency, retrieval, and quality attached to the exact point where each one happened, so a confusing result becomes a clear one. A single trace explains a single run, though, and the patterns worth fixing usually show up only across many of them.
What to observe at each layer of the AI stack
Knowing what to capture in a trace is half the job. The other half is knowing where to look when something goes wrong. An AI agent is not one piece of software but a stack of layers working together, from the app a user interacts with down to the AI model and the infrastructure it runs on. Problems can start at any layer of the stack. Watching the right signals at each layer helps you pinpoint what changed the agent’s behavior.
OpenTelemetry (aka OTel) helps standardize how traces get emitted and carried across heterogeneous systems, especially when model execution happens through managed providers. The harder part is integration: tying those traces together end to end so model-level confidence, retrieval quality, tool behavior, and infrastructure anomalies resolve into one operational view, from orchestration and retrieval to model and tool calls and downstream services.
The gap between observability and agent improvement
Most teams have tracing, but fewer have evaluations
Most teams have started observing agents, but fewer have connected traces to the evals and fixes that make agent quality improve. In our State of Agent Engineering survey, 89% of all organizations and 94% of production-agent teams have some observability; 62% of all organizations have detailed tracing, and 72% of production-agent teams have full tracing.
Teams are getting better at seeing what agents do in production, but many still struggle to turn what they learn from traces into evals and fixes: 52% report offline evaluation, and 37% report online evaluation. Many teams can see production behavior, but fewer have a systematic way to turn those traces into quality improvements.
Domain failures need an owner and a next step
When an agent is slow, errors out, or costs too much, engineers usually know what to do next because those signals map to code and infrastructure. But many agent failures are judgment calls. The stack can look “healthy” while the agent is still wrong:
- A legal research agent cites an outdated case.
- A healthcare summary misses a medication interaction.
- A finance agent labels a risk as low even though the trace contains evidence that should have changed the answer.
Observability only helps here if someone owns the review and each signal has a clear next step:
- A negative user rating should point to a specific trace to review.
- A recurring mistake should become an evaluation (an “eval”), which is a repeatable check that catches the same issue in future runs.
- A domain expert’s correction should become a saved example the team can test against.
- A drift pattern should become an experiment or a fix you can measure over time.
- A policy violation should create a governance event with an owner and a follow-up.
When a production failure ends as a Slack thread instead of an issue, eval, or fix, the agent does not reliably improve release after release.
How LangSmith Engine turns traces into fixes
Production traces accumulate faster than any team can read them. Negative ratings, failed tool calls, and recurring hallucinations all leave a trail, but someone still has to cluster the related traces, name the failure, diagnose the root cause, and draft the fix. Most teams do that work by hand, between releases, when they have time, so the same failure mode ships through several releases before it gets resolved.
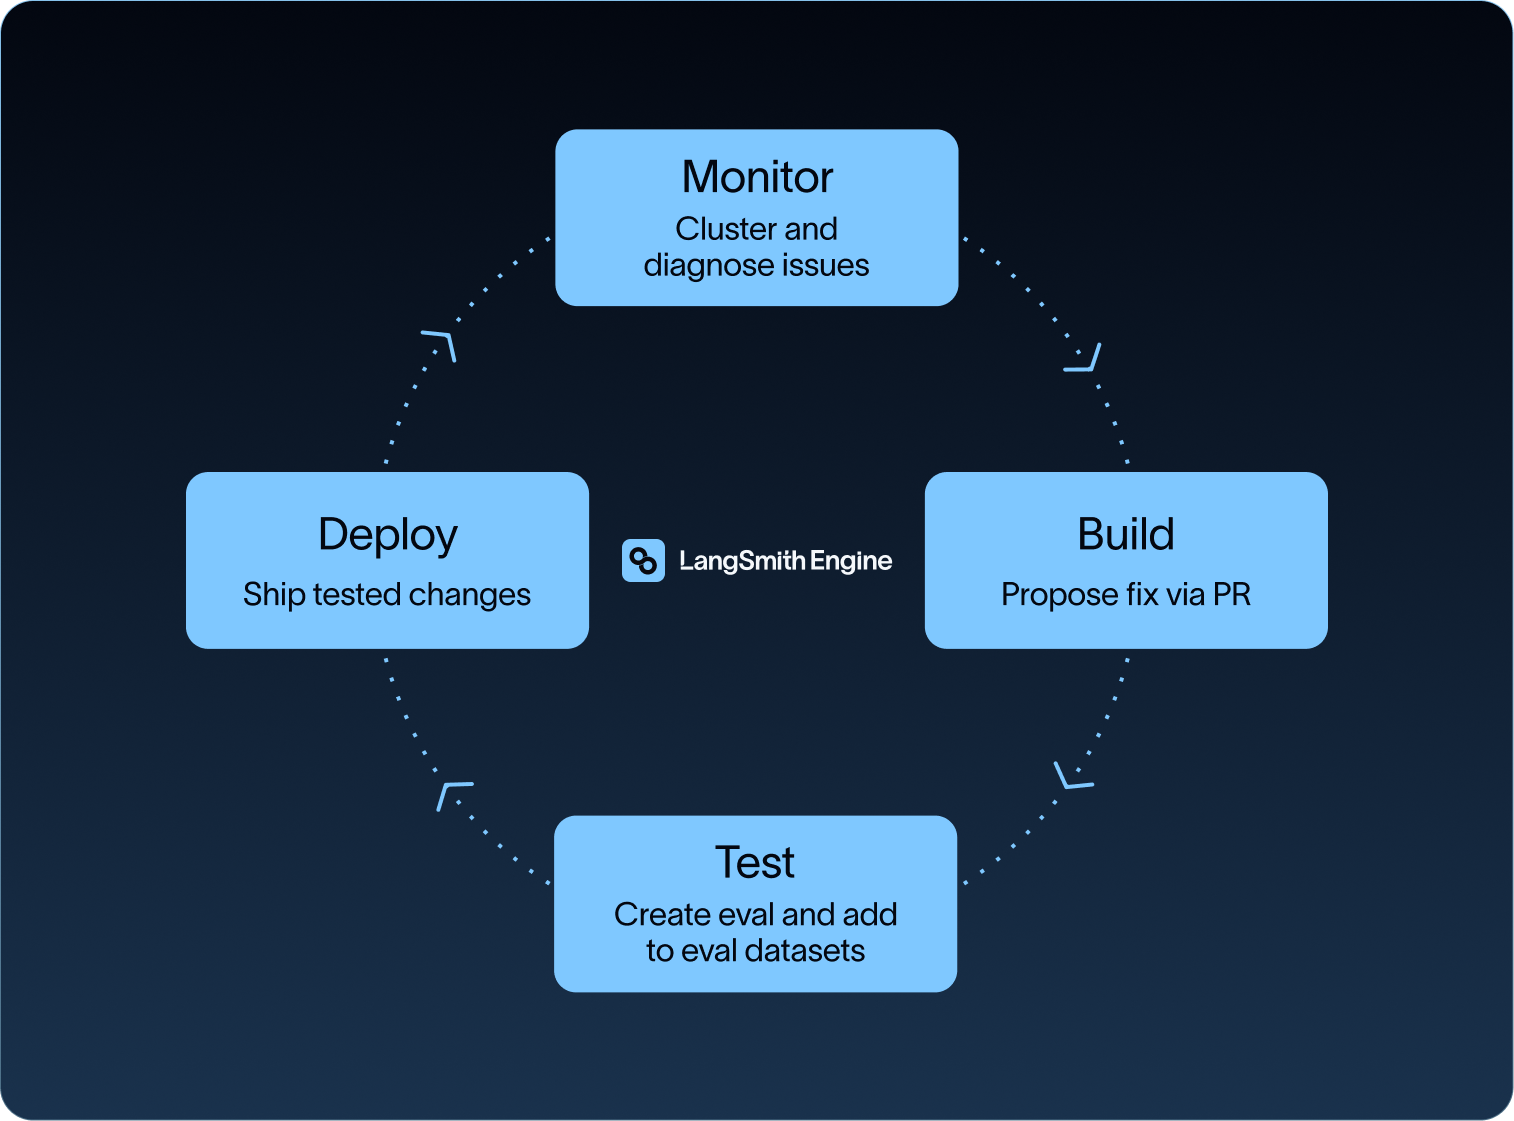
LangSmith Engine automates that triage. It analyzes production traces, groups related failures into named issues, summarizes what is going wrong, suggests what needs to change, and drafts prompt or code fixes for review.
Engine finds recurring production failures
Engine runs against LangSmith traces and looks for patterns in unmet user expectations or agent failures. Instead of asking someone to read individual traces until a pattern emerges, Engine groups related traces into named issues and prioritizes them by severity and team preferences.
Engine drafts fixes and evaluations
The workflow moves from detection to prevention in four steps.
- Detect the pattern. LangSmith Engine analyzes production traces and finds related failures across the project.
- Name the issue. Engine summarizes the failure mode with evidence from the specific traces that triggered it.
- Identify the change. Engine diagnoses the root cause and pinpoints the specific prompt or code change that would resolve the issue.
- Draft the fix and eval. Engine can open a GitHub PR with the proposed change, suggest an online evaluator that tracks whether the issue stays fixed, and recommend failing examples for the offline eval dataset.
Without an eval, regressions are hard to catch, and the same failure can reappear after the next release. LangSmith Engine connects the fix to the production failure pattern, so it can be tracked and resurfaced if it returns.
Teams still review the proposed changes
Engine still leaves review with the team, which keeps judgment with the people accountable for the release. Engine spots patterns across many traces, suggests fixes, and drafts the artifacts teams need to act, such as a pull request or an eval. But it does not ship changes by itself. Engineers review whether the technical diagnosis and proposed code change make sense. Domain experts review whether the agent’s behavior is acceptable for the real-world use case. Then the normal release process decides what merges, what ships, and when.
Storing and querying agent traces at scale
Agent traces force a different set of requirements than typical observability data. They are large, nested, and interactive. To diagnose a single failure you need to open a single run, expand the tree, inspect tool inputs and outputs, and then pivot to a query like "show me every run with this same failure signature" across thousands of other runs. General-purpose log stores were not built for that pattern, which is why long-running agent projects start to feel slow exactly when teams need them to feel fast.
A trace store that works for agents needs to support:
- Tree-first reads (load a full trace quickly, not just spans in isolation)
- Fast interactive filtering across large runs and long histories
- Full-text + structured search over prompts, tool calls, metadata, and outputs
- Aggregations that surface patterns across many runs (not just one)
SmithDB is built for those trace-native query patterns inside LangSmith, our framework-agnostic agent observability platform. It supports random access, interactive filtering, full-text search, JSON filtering, tree-aware queries, thread reconstruction, and aggregations over large agent traces, so production traces stay usable when you move from a handful of runs to a long-running agent project.
Fast trace search keeps teams reviewing traces
SmithDB can deliver P50 latencies of 92ms for trace tree loads, 400ms for full-text search, and 82ms for run filtering, with core LangSmith experiences up to 15x faster. At that speed, teams can search patterns while the incident, eval, or code change is still fresh. If it takes minutes to search a long-running agent project, engineers sample less, domain experts review less, and fewer production failures become evals.
Portable storage keeps traces usable at scale
SmithDB is backed by object storage, with stateless ingestion and query services. Teams can scale by adding compute rather than managing local disks or complex sharding, which keeps trace search viable as projects accumulate more long-running runs.
How expert feedback improves agent quality
Some production failures look fine in the metrics but are still wrong to a domain expert. AI observability can show that the agent retrieved five documents and answered in two seconds. It cannot decide, by telemetry alone, whether those documents were current, jurisdictionally relevant, medically complete, or aligned with company policy. Closing that judgment gap takes a workflow built around the people who can make the call, not another dashboard.
Reviewers score individual agent runs
Annotation Queues in LangSmith give human reviewers a focused workflow for attaching feedback to specific runs. Reviewers can group runs, apply rubrics, and track progress. They can add notes, score feedback criteria, and turn reviewed runs into dataset examples. Product managers, clinicians, lawyers, analysts, and support leads can evaluate the part they understand without reading the whole trace tree like an engineer.
Use human review for high-judgment cases
Human review cannot cover every trace, and it should not attempt to. Automated evals can handle routine checks, and LLM-as-a-judge evaluators can handle rubric-based scoring.
Annotation Queues are for the cases where judgment is costly and worth it. High-stakes workflows, negative user ratings, known drift patterns, and unresolved Engine issues are all good candidates to route to expert review.
The review interface keeps the run, the rubric, and the reviewer controls in one view, so a clinician, lawyer, or analyst can score a run without leaving the queue.
The review process also needs quality control, and Annotation Queues support rubrics, reviewer notes, reviewer counts, and reservations. They also support assigned reviewers and queue states such as Needs Review and Completed. Those controls make reviewer feedback easier to trust: teams can see who reviewed the run, which criteria they used, and whether enough reviewers agreed to treat the result as a signal.
Turn corrections into evaluations
To make expert feedback usable, teams need two passes. First, engineers review the full execution path, including tool calls, retrieval steps, and intermediate outputs, to diagnose what happened and what needs to change.
Then domain experts review the user-facing input and output with the right rubric and context to judge correctness. When an expert flags a run as wrong, that correction becomes a dataset example or an eval criterion, so the next prompt or code change is tested against a real production failure, not someone’s memory.
How LLM Gateway enforces policy before model calls
Compliance work changes when the observability layer can enforce policy before a provider call and connect the policy event to the trace that triggered it. Runtime governance belongs in the same loop as tracing because the policy decision is part of the agent's behavior.
Enforce spend caps and provider access
An LLM Gateway sits between agents and the LLM providers they call. It enforces hard spend limits at the organization, workspace, API key, or user level, and the caller receives a 402 response when a cap is reached. It also centralizes provider credentials so individual clients do not need to store provider keys locally.
Redact sensitive data before model calls
LangSmith LLM Gateway supports PII protection and secrets redaction before requests reach the model. It can redact common sensitive data types, including personal identifiers and credentials (for example, names, locations, religious or political attributes, ages, phone numbers, Social Security numbers, API keys, tokens, and private keys). This moves protection earlier in the request path, before sensitive data reaches the provider.
Connect policy events to traces
Every gateway-proxied call appears as a trace in the same LangSmith workspace as the rest of the agent's traces. Policy violations surface as issues in LangSmith Engine, and teams can click from a violation to the trace that produced it. Audit logging records administrative changes to gateway configuration and gateway invocations.
The trace still explains what happened, while LLM Gateway can block the request, record the policy event, and connect that event to the same remediation surface as quality failures. A spend cap, for example, returns a 402 response with an actionable error message. That keeps enforcement on the runtime path and gives teams an audit trail during remediation.
For regulated teams, the audit trail records administrative changes, gateway invocations, and policy events alongside the trace that triggered them.
Start with one monitor loop
The right starting point is one production signal that already affects release quality: a failed tool call, negative user rating, hallucinated answer, policy violation, or recurring unresolved issue.
Pick one agent and one failure you care about, then run a single loop:
- Capture the trace in LangSmith when that failure happens, so you can see exactly what the agent did.
- Turn that failure into one eval, a repeatable check that catches the same issue in future runs.
- Re-run the eval before your next deploy, then check whether the same pattern returns after release.
Once that workflow is running, add more coverage where the risk is highest: route high-judgment cases to Annotation Queues, let Engine surface recurring failures, or put LLM Gateway on the runtime path for spend and PII controls.
LangSmith brings these pieces together in one framework-agnostic platform: tracing, trace-native storage, automated triage, expert review, and runtime policy enforcement. That gives teams one place to inspect what happened, decide what needs to change, and verify the agent behaves better after the next deploy. Get started with LangSmith today.