AI Agent Monitoring: Why Traditional APM Falls Short
Application performance monitoring (APM) was designed for software that behaves deterministically. A request arrives, follows a defined code path, and returns a response. Failures are usually obvious. A service is up, or it's down, or it returns a 500. That design assumption is correct for most traditional software, but doesn’t apply to AI agents.
Agent failures (a wrong tool call, a bad intermediate decision, a retry loop that will not exit, etc.) never trip an alert in traditional APM tools, because they happen in a layer that traditional APM was never designed to monitor.
If your agent wraps a single model call and returns a response, you probably don't need true AI agent monitoring. But once it makes tool calls, branches on intermediate results, or runs for more than a few seconds, catching those failures requires more than what APM tools provide. You need tracing that shows every step, cost and latency attributed per node, and evaluation that catches quality drift before your users do.
How APM fails at AI agent monitoring
APM instruments the infrastructure layer, and agent failures happen above it. A single user request fans out into dozens of nested spans across model calls, tool invocations, and retrieval steps, each making independent decisions that shape what comes next. When a step returns a non-error response that is plausible but wrong, the agent treats it as ground truth and makes the next decision on bad context. No error code propagates up the chain, so the failure gets baked into the context window and influences every subsequent step. By the time a wrong answer surfaces, the trace that explains it spans multiple agents, tools, and model calls that your APM platform never recorded.
The observability community has had to build a new telemetry layer to close this gap. OpenTelemetry (aka OTel)'s GenAI Semantic Conventions now standardize how agent operations are recorded as structured spans, covering what traditional OTel conventions don't touch:
- Model calls with token counts and finish reasons
- Tool invocations with input parameters and return values
- Retrieval steps with query and result payloads
- Multi-step agent runs as nested parent-child spans
Each of the measurements in the right column roll up into monitoring categories, covering failure modes that infrastructure metrics cannot surface.
Four signals for monitoring AI agents in production
Agent observability requires monitoring what the agent received, which execution path it followed, and what it produced at every step. Traditional APM gives you three pillars (latency, errors, and throughput). Agent monitoring requires four distinct signals:
- Tool call tracing
- Intermediate execution steps
- Multi-turn conversation health
- Step-level cost and latency
Tool call tracing
AI agents interact with external systems, including APIs, databases, search indexes, payment systems, and internal services. Each tool call is a potential failure point. The tool might return stale data, timeout, or succeed but return results that the agent misinterprets. Traditional APM sees the HTTP call to the external API. Agent observability tools capture what the agent asked the tool to do, what the tool returned, and how the agent used that result in its next step.

A tool can succeed and still be wrong. An agent might call a pricing API with the wrong currency parameter, then the API returns a valid response (200 OK, no error), and the agent passes the wrong price into its recommendation. Without tool call tracing that captures arguments and return values, that failure stays invisible.
Intermediate execution steps
An agent doesn't have a fixed path. It builds its own path at runtime, interweaving model calls, tool use, and state changes as it goes. Traces capture that path, including which model was called, what prompt it received, what it generated, which tools it used, and what happened next.
Those records can show how an agent arrived at a clean-looking but incorrect result. An agent tasked with summarizing a legal document could retrieve the right document but fixate on an irrelevant clause because its prompt emphasizes recency over relevance. The summary would come back coherent, grammatically clean, and wrong, and only step-level tracing would reveal where the execution diverged.
Multi-turn conversation health
Quality problems in multi-turn interactions are often impossible to spot at the individual response level. A bad assumption in turn three can compound through turns four, five, and six until the conversation produces an outcome that fails the user's original goal.
The compounding is easy to miss because each turn looks fine on its own. A customer support agent might correctly identify a billing issue in turn one but misinterpret a follow-up question in turn three as a new issue. It switches context, loses track of the original problem, and the customer gets a resolution for the wrong issue. Each response scores well in isolation, but the thread as a whole fails the user.
Step-level cost and latency
Every node in an agent's execution graph has a cost (tokens consumed) and a latency (time elapsed). Aggregate metrics hide the distribution. An agent might complete a task in 12 seconds total, which looks acceptable on a latency dashboard. Step-level attribution reveals that 9 of those seconds come from a single retrieval step calling an overloaded API, while the model calls complete in under a second each.
AI observability is now table stakes. According to our State of Agent Engineering survey, 89% of teams have implemented some form of it. However, offline evals adoption tells a different story, with only 52% of teams conducting them. That leaves many teams with production telemetry but no systematic way to test whether an optimization preserves quality. Step-level cost and latency data identifies where to intervene, while offline evals verify that the change does not degrade the agent's output.
How agent costs compound across steps
Unlike a fixed API call, an agent accumulates cost at every node across a multi-step task, and that spend is rarely distributed evenly. One sub-task might consume the vast majority of total tokens while contributing a small fraction of the value. The aggregate dashboard gives you a total, not the step that drove it.
The problem compounds in agent loops. Each iteration adds tokens to the context window, so the cost of every subsequent pass grows. A loop that runs three extra iterations before exiting can cost significantly more than projected, and nothing in the infrastructure layer flags it.
Step-level tracing turns cost from a monolithic budget line into a per-node engineering decision. Three metrics make that possible:
- Input and output tokens per trace
- Tool call latency
- Cost per node
What this looks like in practice
Take an agent that processes customer support tickets through five steps: it classifies the ticket, retrieves relevant documentation, generates a draft response, checks the response against policy, and formats the output. Here is how you'd trace that agent to find where the cost concentrates and cut unnecessary token spend safely in four moves:
- Instrument with step-level tracing: LangSmith, our framework agnostic observability platform, captures input and output tokens per trace and tool call latency at each of those five nodes, so you see a cost and latency breakdown per step rather than a single aggregate number. Designed to plug into whatever models, frameworks, and infrastructure you already run, LangSmith is the connective tissue across the stack.
- Identify where the spend concentrates: In a typical pattern, the draft-generation step dominates token spend because it runs on a large frontier model. Classification, policy-check, and formatting use that same expensive model for tasks that don't require frontier-level capability.
- Swap the model on the cheap steps: Move the non-generation steps to a smaller, faster model. The generation step stays on the frontier model, where output quality is most sensitive to model capability.
- Validate with evals: Run your evaluation suite against the modified agent and compare output quality scores before and after. If the scores hold, the swap is safe. If quality drops on specific steps, you've identified exactly which node needs the more expensive model. Without evals, the only options are keeping the expensive model everywhere or swapping and hoping nothing breaks. Step-level data lets you make the change and back it with before-and-after quality scores.
The same logic applies to latency. End-to-end latency tells you the agent is slow. Step-level latency tells you whether an 8-second response time comes from a slow model call, a slow tool API, or a loop that ran three extra iterations. Each diagnosis points to a different fix. Teams using LangSmith running millions of traces can filter and aggregate these metrics to identify which nodes are consistently expensive and which tool calls are consistently slow.
Why failures are higher in multi-agent systems
Multi-agent systems amplify the core problem that APM tools don’t solve: one agent can appear to finish its run with a valid-looking output, then the next agent acts on incomplete context. The handoff fails and by the time a wrong answer surfaces, the root cause is buried behind two or three agent boundaries.
We see this pattern across enterprise deployments. A representative handoff failure in this type of system looks like this: a classification agent truncates context to fit within token limits, dropping a critical detail. The next agent acts on what it received, builds a response on a false assumption, and the customer gets incorrect information. Each agent did its job within the constraints it was given, but the system failed the user because of what was lost between the agents.
Monitoring this category of failure requires tracing that propagates context across agent boundaries. Without it, debugging a cascade failure means manually reconstructing the handoff chain from separate logs, and most teams give up and retry the entire request instead. Doing this well requires three capabilities:
- Parent-child span relationships that link each agent's output to the next agent's input
- Cross-agent cost and latency attribution
- Distributed tracing that reconstructs the full execution tree across agent boundaries
LangSmith captures the complete execution tree across agent boundaries, making it possible to attribute cost and latency to specific nodes even when those nodes span different agents.
How to evaluate agent quality at scale
Tracing tells you what happened, while evaluation tells you whether the output met the quality bar your users need. At production scale, this becomes a volume problem. A team processing 200,000 requests per day cannot manually review every trace. With hundreds of thousands of requests, a full manual review is structurally impossible.
Running automated evaluation and human review as a connected system is how teams close that gap, with each method making the other more effective.
Scoring outputs with LLM-as-a-judge
LLM-as-a-judge evaluators score agent outputs against defined criteria, including accuracy, helpfulness, format compliance, and safety. They run on sampled production traffic, typically 10% of requests, and flag traces that fall below score thresholds, giving teams a real-time signal on quality drift without requiring a human to read every output.
We've found that you can depend on LLM judges to catch clear failures like format violations, obvious hallucinations, and safety issues. They can also detect trends over time, such as quality scores declining after a model update. Subjective quality judgments requiring domain expertise are a different matter. An LLM judge cannot reliably determine whether a medical summary captured the clinically relevant information, or whether a legal analysis addressed the right precedent.
Annotation queues
Some quality calls require a domain expert. An LLM judge might score a legal analysis that cites the right statute but misses the controlling precedent as correct when a human lawyer would not.
Annotation queues route traces like these to domain experts, including clinicians, lawyers, analysts, and product managers for structured review with a predefined rubric. Reviewers score outputs, flag errors, and add context that feeds directly into evaluation datasets. They work best when focused on specific high-value traces rather than attempting full coverage.
A practical routing guide:
- Format compliance, safety violations, and obvious hallucinations: use automated evaluators
- Domain-specific correctness in legal, medical, or financial outputs: route to annotation queues for expert review
- New or uncharacterized failure modes: route to annotation queues to build the initial labeled dataset
- Borderline evaluator confidence scores: route to annotation queues so experts can establish ground truth
- High-value or high-risk interactions: default to human review regardless of automated score
How the calibration loop works
The two channels become most powerful when connected. Here is how we set it up:
- Online evaluators run on sampled production traffic and score each trace
- Traces that score below a threshold, or where the evaluator's confidence is low, route automatically to an annotation queue
- Domain experts review those flagged traces and provide corrections
- Those corrections feed into Align Evals, which lets teams iterate on the evaluator prompt against a golden set of human-graded examples until the LLM-as-a-judge's scores align with human judgment
- The recalibrated evaluator runs on the next batch of production traffic with criteria updated against expert judgment
The LLM judge is continuously calibrated against human judgment on the cases that matter most. Over time, the evaluator reflects the domain expertise that experts encode through their labels, and human reviewers focus their limited time on genuinely ambiguous cases.
Operationally, the setup is lighter than it sounds. Start with one evaluator on one quality dimension, such as format compliance. Set a threshold that catches obvious failures and route borderline traces to a queue staffed by one or two reviewers. From there, build outward as your labeled dataset grows.
For multi-turn conversations, evaluating individual responses is only part of the picture. Multi-turn evaluation scores whether the agent achieved the user's goal across the entire conversation, which requires grouping traces by session and running evaluators at the thread level.
Model drift is the failure mode that most often surfaces only after a user complaint. Output quality degrades gradually after a model update or prompt change without tripping an alert threshold, so error-rate and latency dashboards will not catch it. Evaluators running on live production traffic and comparing scores over time detect the decline before it reaches users.
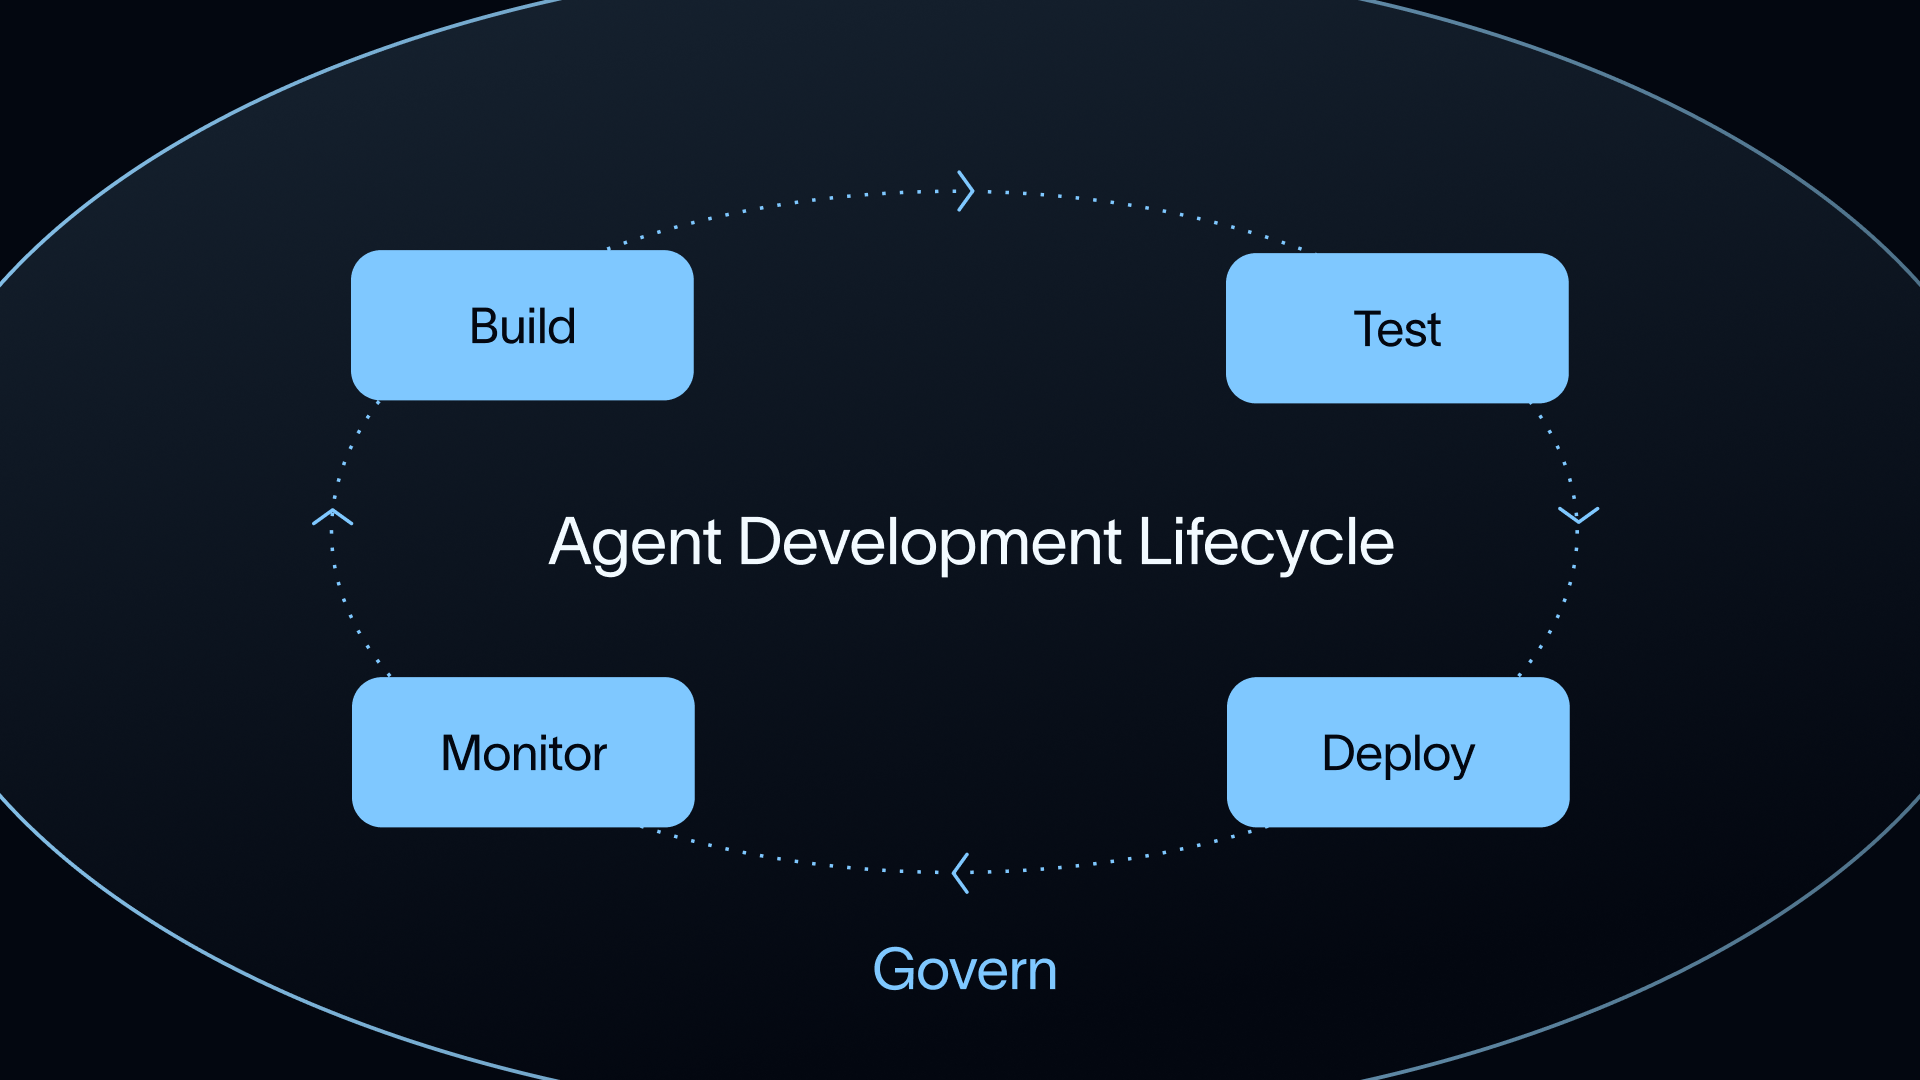
How to build the agent improvement loop
Every production failure is either a one-time fix or the first entry in a regression suite. The teams whose agents improve fastest treat it as the latter.
LangSmith serves more than 300 enterprise customers and has processed more than 15 billion traces. The pattern we see in the fastest-improving teams follows five steps:
- Trace collection: Every agent interaction is captured as a trace rendering the full execution tree, including model calls, tool invocations, intermediate outputs, cost, and latency at each step.
- Pattern detection: Insights surfaces recurring patterns across production traffic, identifying which query types produce low-quality responses, which tool call sequences correlate with failures, and which user intents the agent handles poorly.
- Dataset creation: Problematic traces become test cases with one click, preserving the input, the incorrect output, and, where available, the correct output. Over time, these grow into regression suites covering the failure modes a team has actually encountered.
- Evaluation: Offline evals run against those datasets to verify the proposed changes fix identified problems without introducing regressions. Online evals continue running on production traffic to detect new issues and quality drift.
- Targeted improvement: The fix might be a prompt change, a model swap in a specific sub-task, a tool configuration adjustment, or a caching layer on a slow retrieval step. The trace data from step one tells you exactly where to intervene.
Automations make this loop configurable without manual intervention. A threshold rule can route any trace scoring below 0.7 to an annotation queue, a tag-based rule can add tool-call failures to a regression dataset, and an evaluator schedule can re-score production samples on a defined cadence.
Where to start
The right monitoring strategy depends on where you are in the agent lifecycle:
- Start with tracing. Before you can optimize or evaluate, you need visibility. Instrument your agent to capture full traces, every model call, tool invocation, and intermediate step. This alone surfaces problems that are currently invisible to your infrastructure monitoring.
- Add step-level cost and latency attribution. Once you have traces, start tracking input and output tokens per trace and tool call latency at each node. This gives you the data to make per-step optimization decisions instead of guessing where cost and latency come from.
- Layer in automated evaluation. Set up LLM-as-a-judge evaluators on a sample of production traffic. Start with clear, objective criteria (format compliance, tool call correctness) before tackling subjective quality judgments. Even a 10% sample rate gives you a signal on quality trends.
- Add human review for calibration. Route traces that score below your automated thresholds to annotation queues where domain experts can review, correct, and label. Use those labels to calibrate your automated evaluators through Align Evals.
- Build the loop. Start converting production failures into dataset entries. Run offline evaluations against those datasets before deploying changes. Over time, your dataset becomes a living regression suite that prevents the same failure from recurring.
If you're debugging complex agent loops, LangSmith's tracing gives you visibility into every intermediate step, with step-level cost and latency attribution across the full execution tree. It works whether you build on LangChain, LangGraph, Deep Agents, any other framework, or custom code. For teams ready to build the complete monitoring and evaluation loop, the AI agent observability guide covers instrumentation in depth.
What turns a one-time fire drill into a durable improvement is whether your monitoring stack can trace the failure to a specific step, route it to the right reviewer, and convert the correction into a test case that prevents recurrence. This is the shift from reactive debugging to systematic improvement, and it starts with seeing what your current dashboards can't.