LLM observability & monitoring: how to evaluate agent behavior
March 3, 2026
Key Takeaways
- Monitoring helps you understand whether the system stayed up, while observability shows you what the agent did.
- 89% of teams have agent observability instrumented, but only 52% run offline evaluations.
- Failed production traces are the best input for offline eval datasets.
- Human review, online evals, Insights, and LangSmith Engine turn trace review into a repeatable improvement cycle.
LangChain's State of Agent Engineering survey found that 89% of teams have observability for their agents instrumented, but only 52% run offline evals and 37% run online evals. Observability alone helps you inspect a bad run, but it doesn’t complete the full loop for you in terms of turning the failure into regression coverage. For improving agents, observability only matters if it feeds evaluation, because traces are the raw material for turning production failures into repeatable regression tests.
In production, healthy latency and error rates can still hide a wrong tool call, missing context, or an answer that sounds correct but is not. Observability reconstructs what the agent did so teams can evaluate whether it was right, and evals are how teams make that judgment repeatable.
The survey data shows the degree of the gap. Roughly half of instrumented teams have no repeatable way to judge agent behavior:
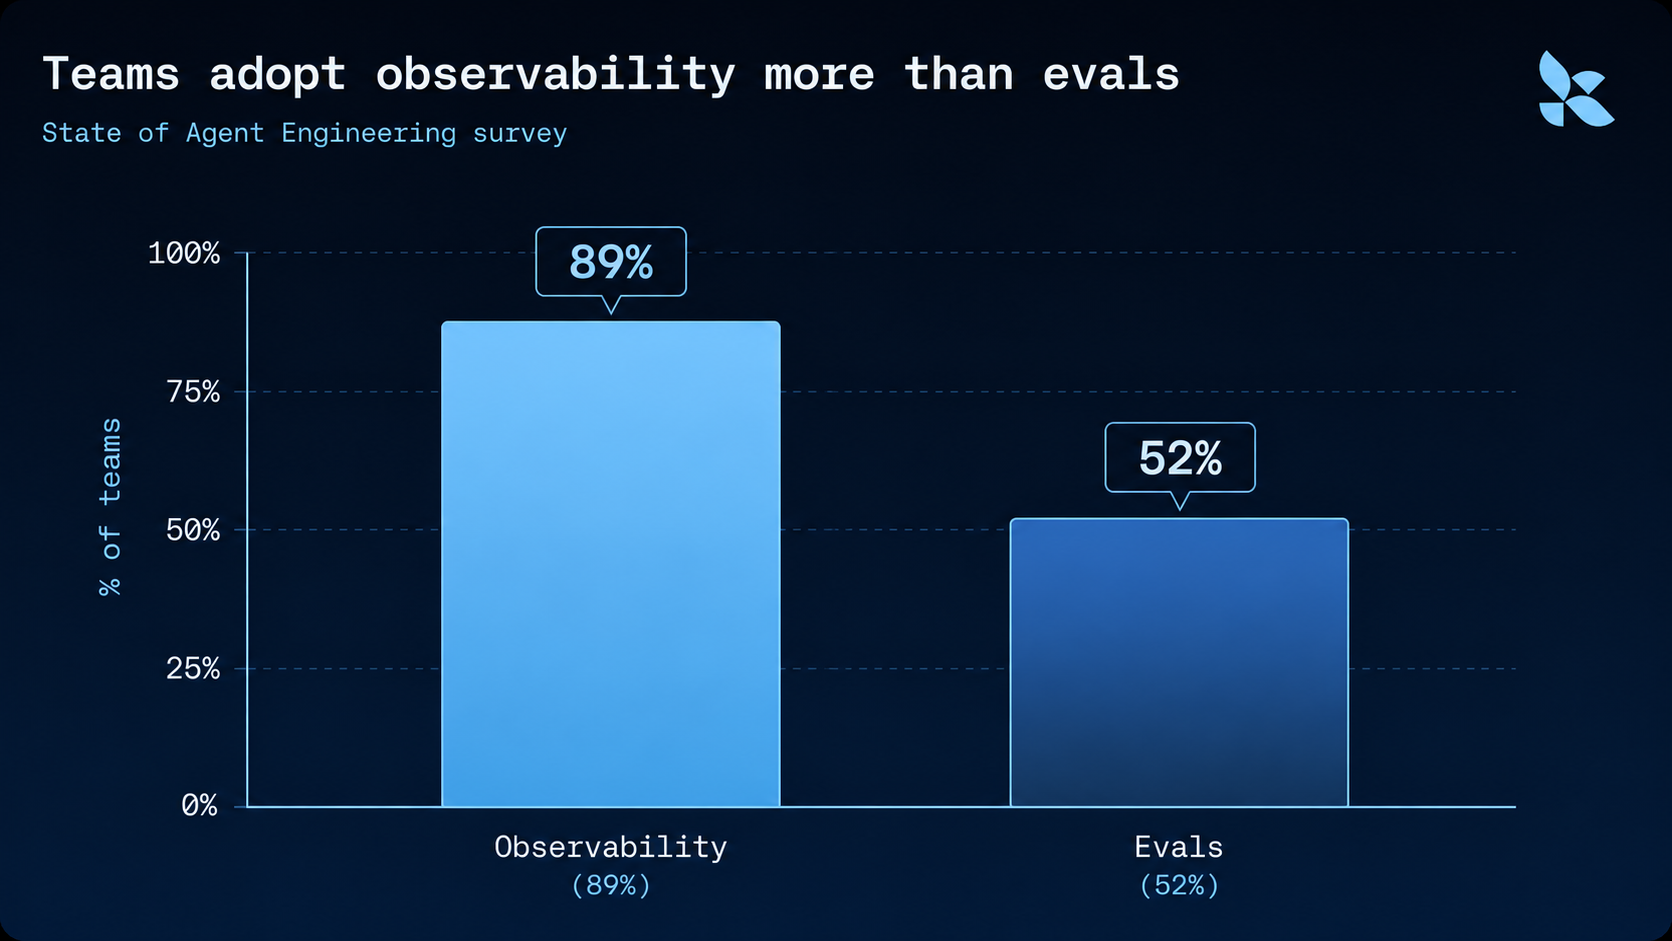
To close that gap, you need the primitives behind agent observability, an evaluation strategy at each level, and a path from production traces to continuous improvement.
What is LLM observability, and how is it different from monitoring?
LLM observability is the practice of capturing an AI agent's traces so teams can inspect the inputs, actions, and downstream results.
LLM monitoring tracks known health signals such as latency, errors, token usage, and cost, so teams know whether the system stayed up but not whether the interaction went well. LLM observability answers that second question by preserving the trajectory behind the response, including model and tool calls, retrieved context, intermediate outputs, final responses, and feedback.
Most teams reach for observability first as a debugging tool. A developer can open the trace, inspect the steps, find where the agent made a bad decision, and stop there. For observability to support agent learning, traces need feedback attached to them so teams can judge whether the behavior was useful, accepted, rejected, inefficient, risky, or wrong.

Why AI agents broke traditional monitoring
APM tooling works best when code defines behavior and the input space is bounded. A conventional service has finite, known code paths, so a fixed set of signals can explain most failures.
AI agents break that model because natural-language input lets people ask for almost anything. A nondeterministic model can take different paths for the same task, and a team cannot know what the agent will do until it runs in production.
For agents, code describes the allowed actions, but the trace records the action taken for a specific input, context, and model response, which is exactly the signal traditional APM cannot see. The trace keeps the user's request, retrieved context, tool arguments, intermediate reasoning, and final response in one place, so the team can reconstruct why the agent behaved the way it did.
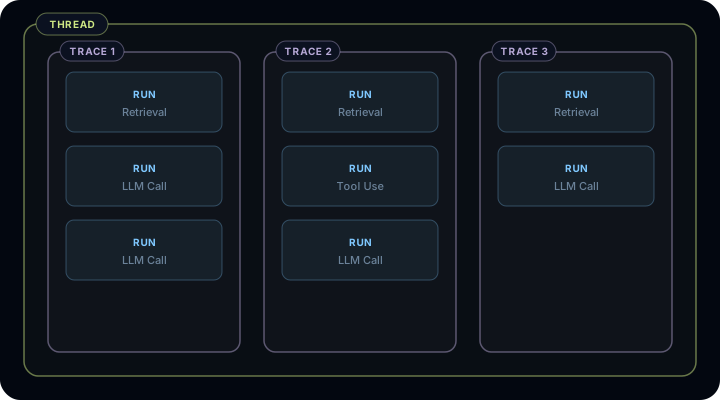
The three primitives of agent observability: runs, traces, and threads
A run is one execution step: one LLM call with the system prompt, tool context, input and output messages, tool calls, and reasoning metadata attached.
A trace is the ordered collection of runs in one execution. An early retrieval result, tool call, or model decision changes what the agent can do later.
A thread groups traces across a multi-turn interaction. In a chat, one AI message can hide a full trace underneath it, and a turn-three failure can start with context introduced in turn one.
The diagram below shows how the three primitives nest inside each other.
If you have worked with OpenTelemetry (aka OTel), a run maps cleanly to a span. LangSmith, our framework-agnostic observability platform, captures runs, traces, and threads so debugging and evals can operate on the same record.
Why observability and evals are coupled for agents
In traditional software, observability and testing often live in separate systems. For AI agents, observability and testing both depend on the trace. Agent logic lives across prompt design, tool behavior, retrieved context, conversation history, model response, and the agent's next action, and the trace is the only record that captures all of it.
Agent evals test behavior across level and mode, which together determine the right evaluation shape.
- Level: one run, one trace, or one thread
- Mode: offline, online, or ad hoc
The eval turns trace evidence into a score, label, or decision.
How to evaluate at each level: single-step, trace, and multi-turn
Developers should start with the failure shape, and then pick the eval level.
Single-step evals score one run, which makes them useful for isolated behaviors like tool choice, routing, and policy checks. They are fast, but they go stale when the agent's internal structure changes.
Trace evals score a full execution and fit when the outcome depends on several steps, such as retrieval, tool use, and state changes. Inputs are easier because the production trace already contains them. Metrics are harder because many steps contribute to the final result.
Multi-turn evals score a full thread and test whether an agent completed the user's job across a conversation. They are the hardest to construct because later test messages can become irrelevant if the agent diverges earlier in the conversation.
The table below maps each level to what it tests and where it fits.
Pick the level that matches the failure you need to catch:
- A tool-selection bug often needs a single-step eval
- A bad refund workflow needs a trace eval
- A support agent that loses context over several turns needs a multi-turn eval
When to use offline, online, and ad hoc evaluation
Offline evals run against a fixed dataset before a change reaches users. Use them for regressions, benchmarks, and release gates.
Online evals run on production traces. They usually don't have ground truth, so they check trajectory, efficiency, quality, safety, compliance, sentiment, or policy adherence as traffic flows.
Ad hoc evals start with an observed pattern. Filter to frustrated-user traces, cluster them with Insights, then decide which failure modes deserve online monitoring or offline regression tests.
Teams discover what to test offline in production. A live failure then becomes a dataset example once the expected behavior is known.
How to turn production traces into tests
When a user reports bad behavior, find the trace first. Tracing allows you to capture the messages, retrieved context, tool calls, files, and environment state at the point of failure. Add that trace to a dataset, anonymize sensitive content if needed, then write the expected behavior. After the fix, run offline evals against the dataset before shipping.
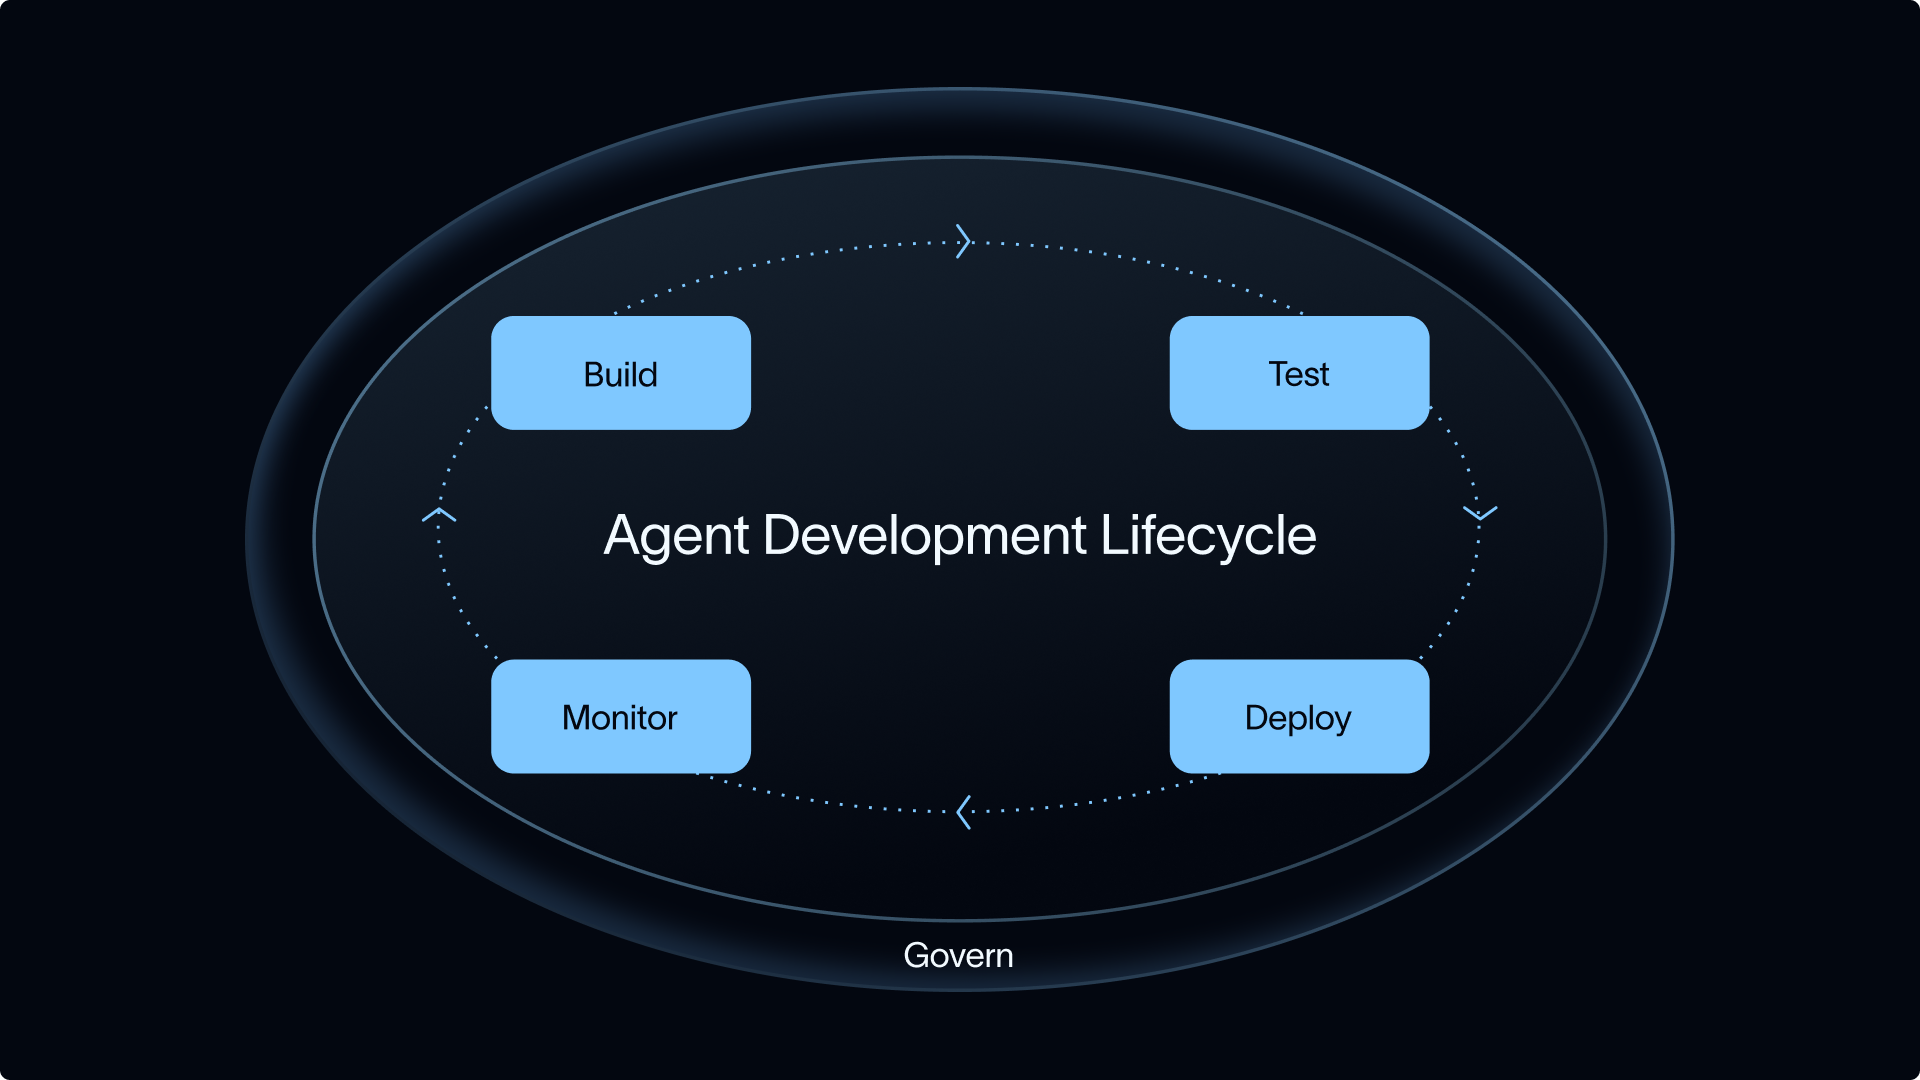
The Agent Development Lifecycle requires the handoff. Production traces contain real inputs and real state, and each corrected failure feeds back into datasets, evals, and the next release. Synthetic tests still help, but they rarely capture the context that caused the first failure.
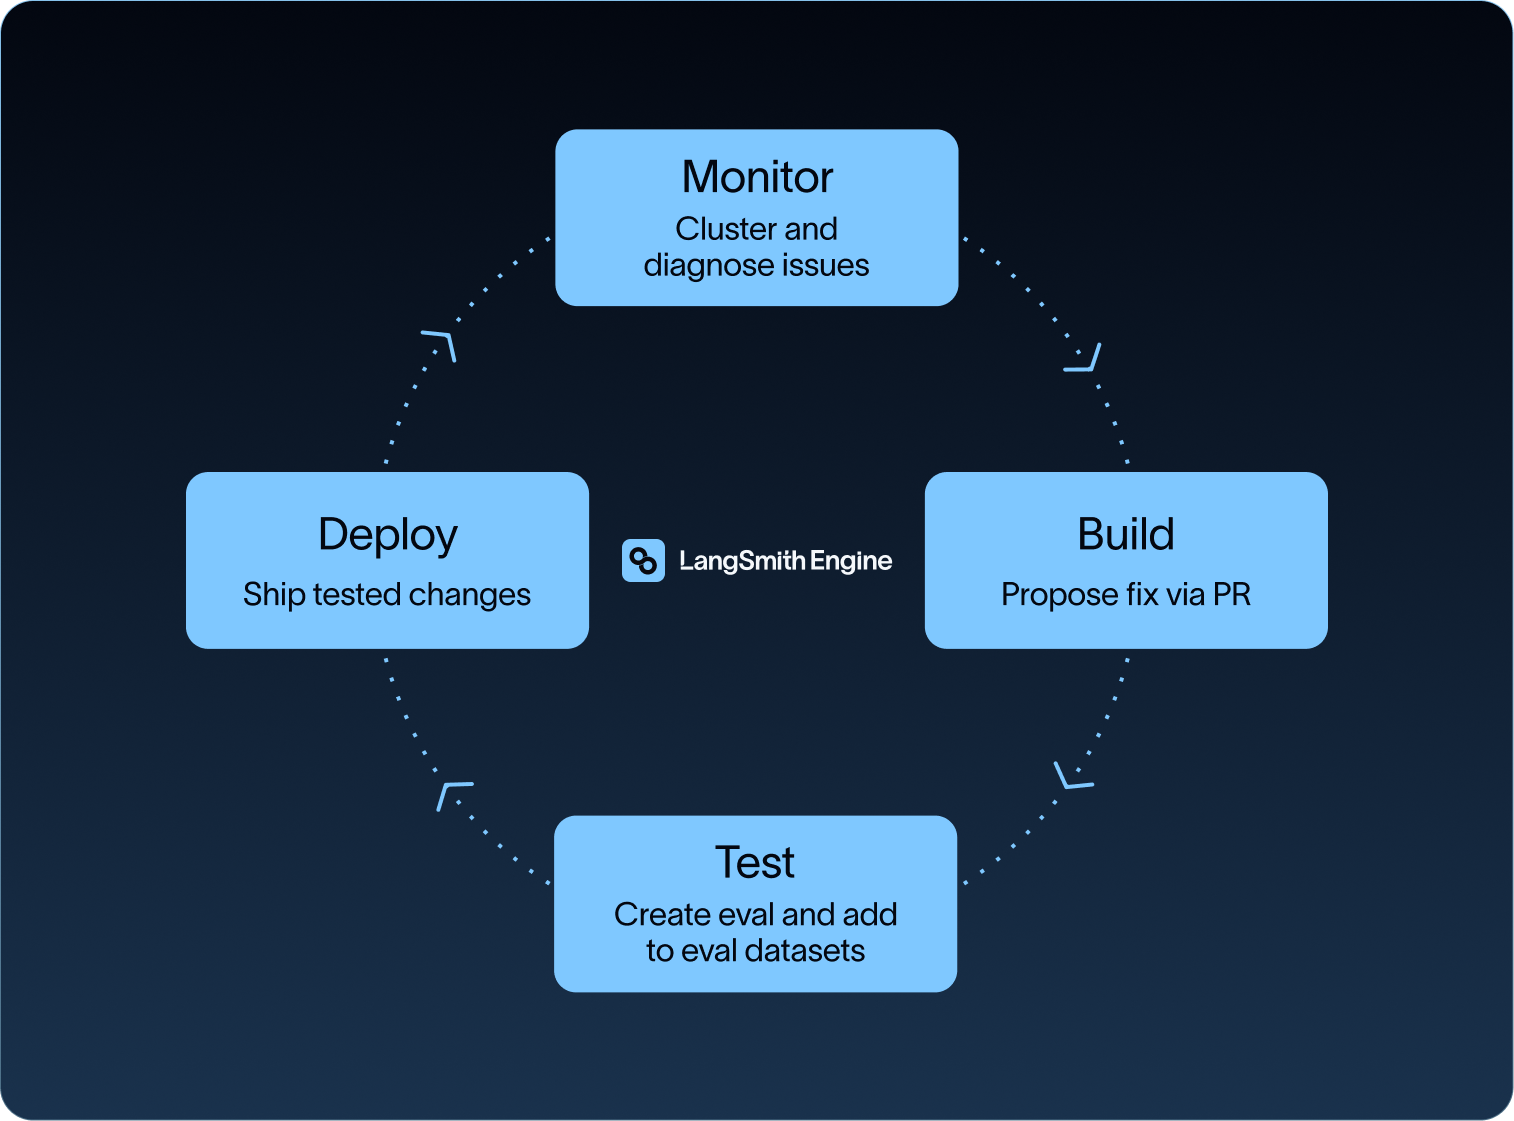
LangSmith lets teams add production traces to datasets. LangSmith Engine extends that path by clustering production failures, proposing fixes, and generating evals to prevent recurrence. Teams running agents at enterprise scale use the same pattern. ServiceNow, for example, builds golden datasets from successful agent runs to catch regressions before they reach users.
How to manage human review at production scale
At production volume, teams cannot read every trace, so they need a way to send the right traces to people while evals cover the rest.
Human review remains necessary for ambiguous judgment calls, new failure modes, and calibrating LLM-as-a-judge evaluators against expert labels. The review surface needs rubrics, queues, assignments, and enough trace context for a reviewer to judge the behavior.
In LangSmith, annotation queues route specific traces to the right reviewers. Automated evals and Insights score or cluster the rest across output quality, safety, compliance, user sentiment, usage patterns, and failure modes.
What to look for in observability tooling
Choose observability tooling based on whether it makes evaluation repeatable: can you score traces, route to humans when necessary, and convert production failures into regression coverage?
When evaluating tooling, consider:
- Trace depth: model calls, tool calls, inputs, outputs, metadata, timing, errors, intermediate state, and feedback.
- Thread-level views: multi-turn agents need conversation-level context, not only single request traces.
- Offline, online, and ad hoc evals: the same trace data supports pre-ship tests, production scoring, and exploratory analysis.
- Human review: annotation queues, rubrics, and collaboration keep expert judgment connected to the trace.
- Framework-agnostic instrumentation: tracing that works across any framework or custom code.
Agent traces can contain hundreds of nested spans, long-running tool calls, and multi-modal content. SmithDB is the data layer behind LangSmith's agent observability workloads, with P50 trace tree loads at 92ms, run filtering at 82ms, and full-text search at 400ms.
For a deeper comparison of tools, see the LLM observability tools roundup. To start instrumenting an agent, try LangSmith’s $0 tier.
Frequently asked questions about LLM observability
What is the difference between LLM monitoring and observability?
Monitoring tracks known signals like latency, error rate, and cost to tell you whether the system is healthy. Observability reconstructs the trace so you can judge whether the agent's behavior and output were correct. Monitoring tells you something went wrong. Observability tells you what the agent did that was wrong.
How are observability and evals related?
Observability provides the trace, and evals score the behavior captured in that trace. For agents, both depend on the inputs, context, actions, outputs, and feedback attached to the execution. Without evals, a trace is just a record; without traces, an eval has nothing real to score.
Can you evaluate an AI agent without ground truth?
Yes. Online evals often run without reference answers. They can score policy adherence, groundedness, trajectory quality, tool use, safety, sentiment, or compliance on production traces.
When should a team introduce AI agent observability?
Add trace-based observability when at least one of three things becomes true:
- Your agent uses two or more tools in sequence
- You're running more than a few dozen requests per day
- Someone other than the original developer needs to debug a failure
Before that threshold, a print statement and a careful read of the output will get a team further than a tracing backend that isn't ready to use. Add tracing when reading the outputs no longer fits in a day.
What eval level should a team start with?
Start with single-step evals on the behaviors most likely to fail: tool choice, routing, and policy checks. Add trace-level evals once the failure pattern requires scoring a full execution rather than one decision.
Start with one traced agent
Instrument one production agent before writing new evals. The first bad trace gives you the input, state, and expected behavior for a regression test. From there, attach feedback, build the dataset, and run evals against the behavior your users already found.